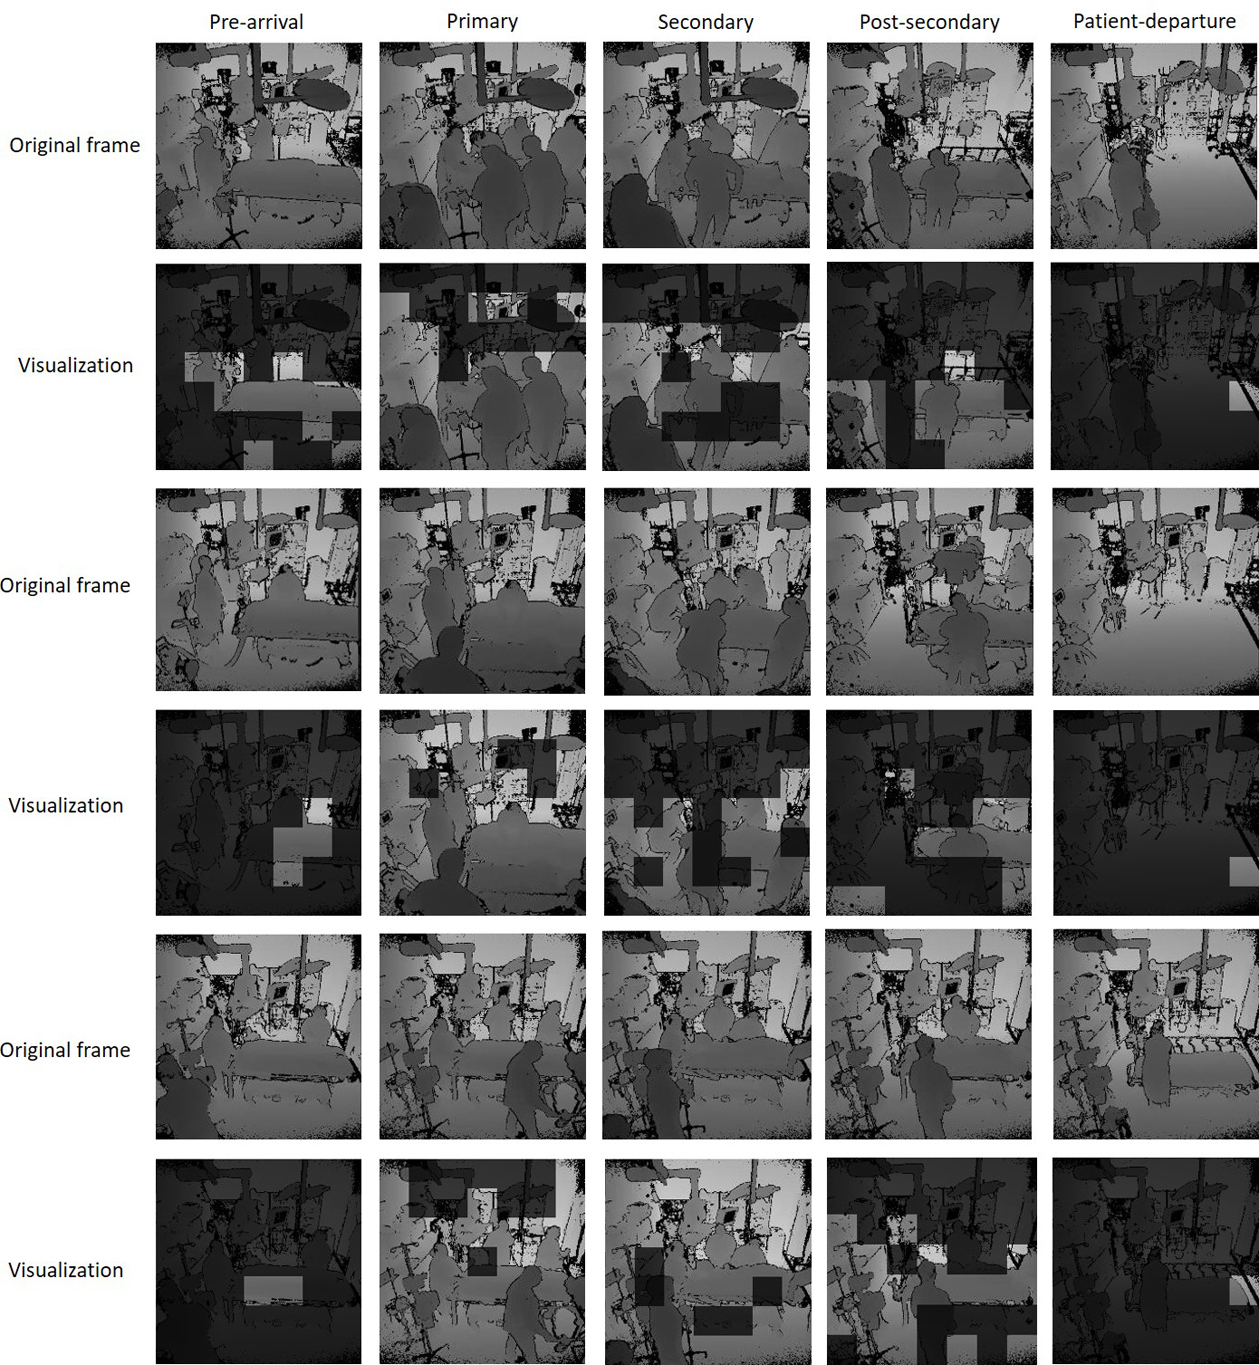
Fig. 8:

Feature visualizations for the five phases and their corresponding depth frames. We overlapped the feature maps on the original frames and used the 0.5 threshold for the values for better visualization.

Feature visualizations for the five phases and their corresponding depth frames. We overlapped the feature maps on the original frames and used the 0.5 threshold for the values for better visualization.