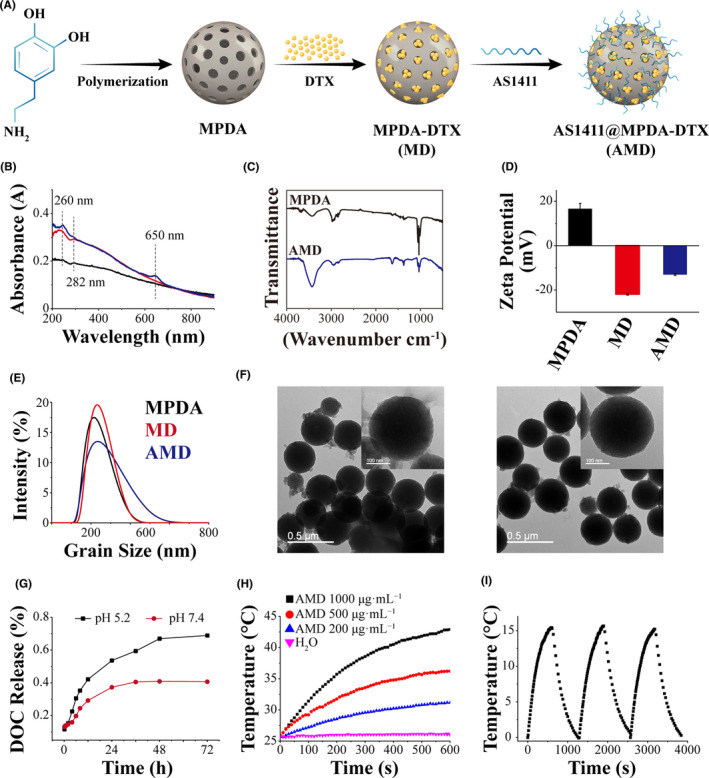
FIGURE 1.

Synthesis and characterization of AMD. (A) Schematic illustration of synthesis of AMD. (B) Spectra of MPDA, MD, and AMD between 200 and 900 nm. (C) FTIR spectra of MPDA and AMD. (D) zeta potential of MPDA, MD, and AMD. (E) size distribution of MPDA, MD, and AMD. (F) TEM images of MPDA and AMD, scale bar: 0.5 μm and 100 nm. (G) In vitro DTX release profiles from MPDA. (H) Temperature elevation of AMD solutions at various concentrations during laser irradiation. (I) temperature elevation of AMD solutions at various concentrations during laser irradiation
