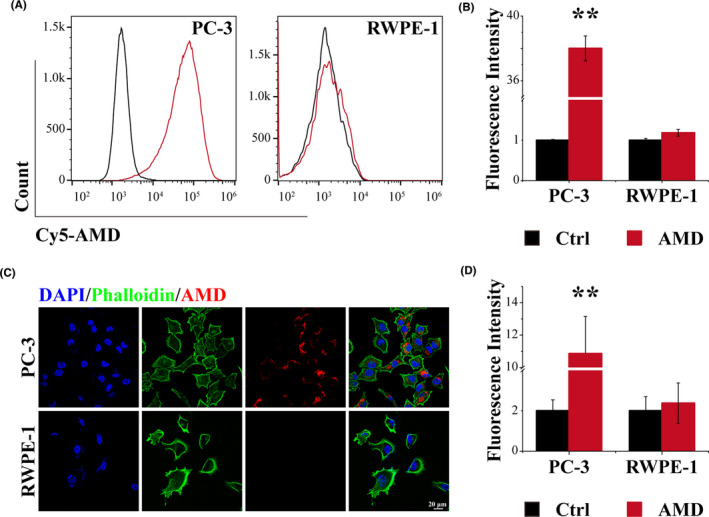
FIGURE 2.

Selective uptake of AMD by PC‐3. (A) Flow cytometry results of PC‐3 and RWPE‐1. (B) quantitative analysis of flow cytometry results. (C) CLSM images of PC‐3 and RWPE‐1, scale bar: 20 μm. (D) quantitative analysis of CLSM images. Data are performed using one‐way analysis of variance (ANOVA) and presented as mean ± SD (n ≥ 3). Statistical analysis: * compared with control, **p < 0.01
