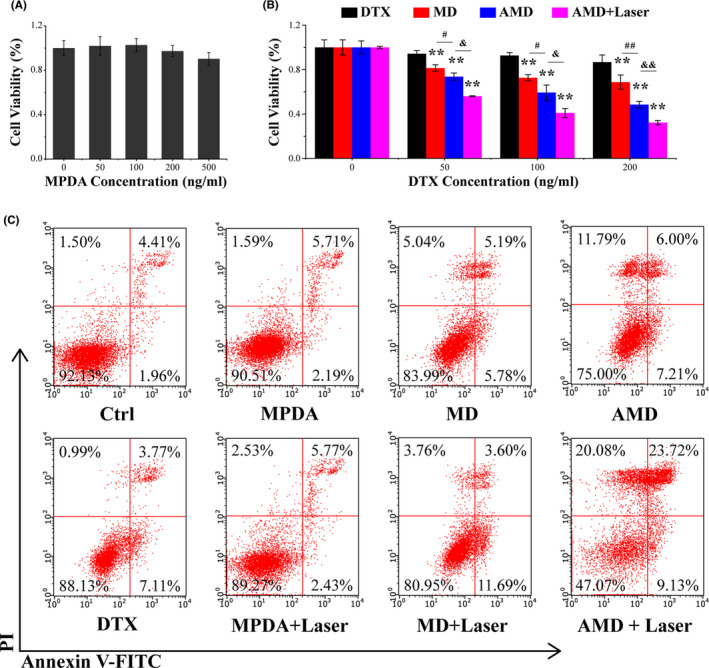
FIGURE 3.

Synergistic therapy of AMD in vitro. (A) Cell viability of PC‐3 after different concentrations of MPDA incubation. (B) Cell viability of PC‐3 after different concentrations of DTX, MD, AMD incubation, and AMD incubation with irradiation. (C) Cell apoptosis of PC‐3 cells after different treatments. Data are performed using one‐way analysis of variance (ANOVA) and presented as mean ± SD (n ≥ 3). Statistical analysis: * compared with control, **p < 0.01; # p < 0.05, ## p < 0.01. & p < 0.05, && p < 0.01
