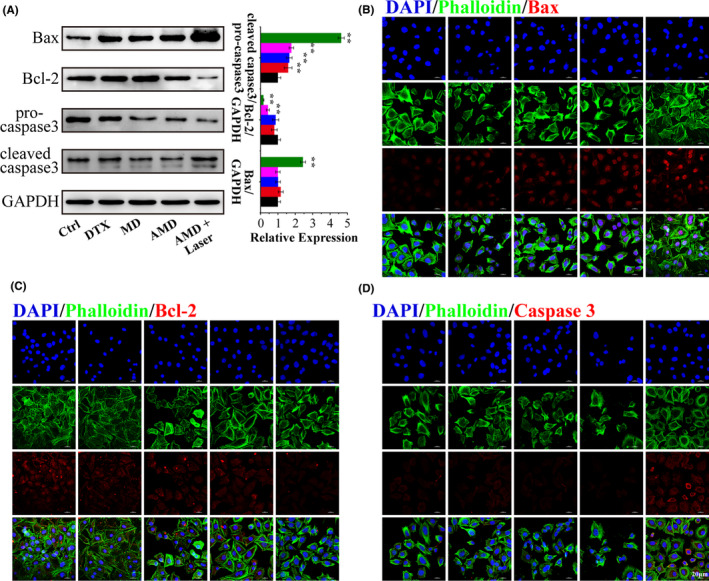
FIGURE 4.

Mechanism underlying the synergistic antitumor effect. (A) Expression of Bax, Bcl‐2, and caspase‐3 detected by Western blot, and the quantitative analysis of Western blot results. (B) immunofluorescence images of Bax. (C) immunofluorescence images of Bcl‐2. (D) immunofluorescence images of caspase‐3. Scale bar: 20 μm. Data are performed using one‐way analysis of variance (ANOVA) and presented as mean ± SD (n ≥ 3). Statistical analysis: * compared with control, *p < 0.05, **p < 0.01; # p < 0.05, ## p < 0.01
