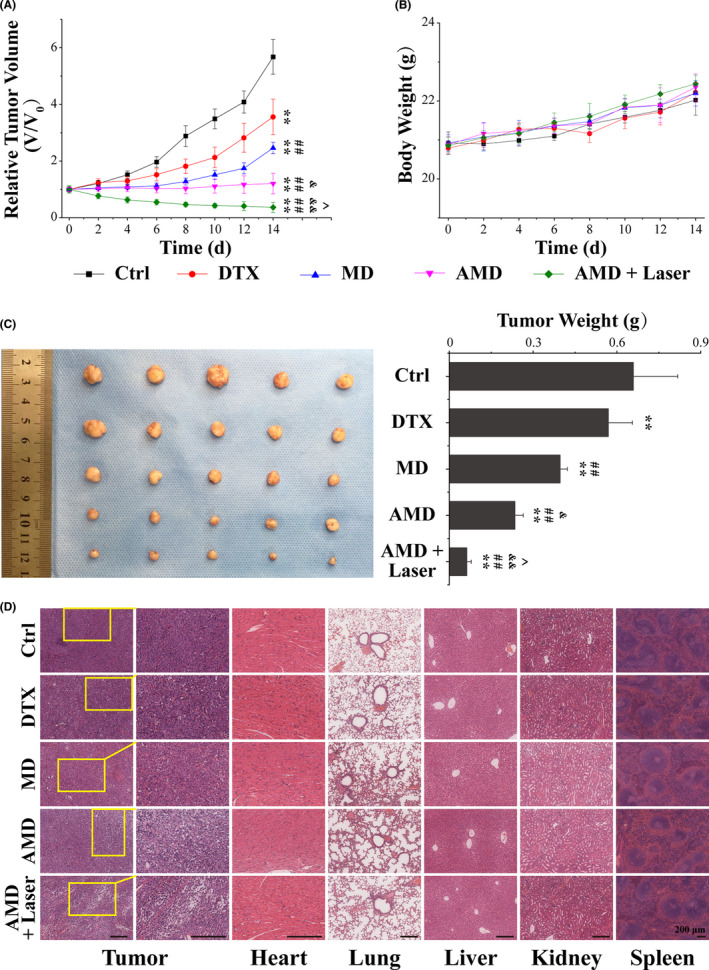
FIGURE 5.

Synergistic therapy of AMD in vivo. (A) Relative tumor volume of PC‐3 tumor‐bearing mice with different treatments. (B) Body weight of tumor‐bearing mice with different treatments. (C) Photographs and weight of tumors dissected from each group on the 14th day after different treatments. (D) H&E staining images of tumor tissues (the second column are a magnified portion of images in the first column) and major organs (heart, liver, spleen, lung, and kidney) dissected from each group on the 14th day after different treatments. Scale bars: 100 μm. Data are performed using one‐way analysis of variance (ANOVA) and presented as mean ± SD (n ≥ 3). Statistical analysis: * compared with control, **p < 0.01; # compared with DTX group, # p < 0.05, ## p < 0.01; & compared with MD group, & p < 0.05, && p < 0.01; ^ compared with AMD group, ^p < 0.05, ^^p < 0.01
