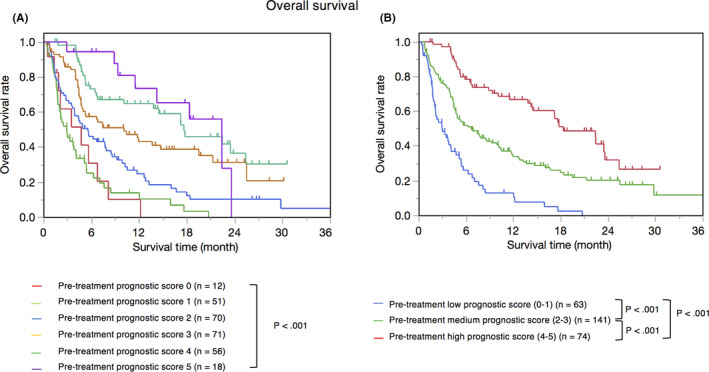
FIGURE 3.

Kaplan‐Meier overall survival according to pre‐treatment prognostic score. (A) Pre‐treatment prognostic score 0 (n = 12) 4.7 months, pre‐treatment prognostic score 1 (n = 51) MST 2.87 months, pre‐treatment prognostic score 2 (n = 70) MST 5.53 months, pre‐treatment prognostic score 3 (n = 71) MST 10.1 months, pre‐treatment prognostic score 4 (n = 56) MST 17.6 months, pre‐treatment prognostic score 5 (n = 18) MST 22.4 months. (B) Pre‐treatment low prognostic score (0‐1) (n = 63) MST 2.97 months, pre‐treatment medium prognostic score (2‐3) (n = 141) MST 6.63 months, pre‐treatment high prognostic score (4‐5) (n = 74) MST 18.3 months. Pre‐treatment high prognostic score group showed significantly better OS compared with pre‐treatment medium prognostic score group (P < .001). Pre‐treatment medium prognostic score group showed significantly better OS compared with low pre‐treatment prognostic score group (P < .001). MST, median survival time; OS, overall survival
