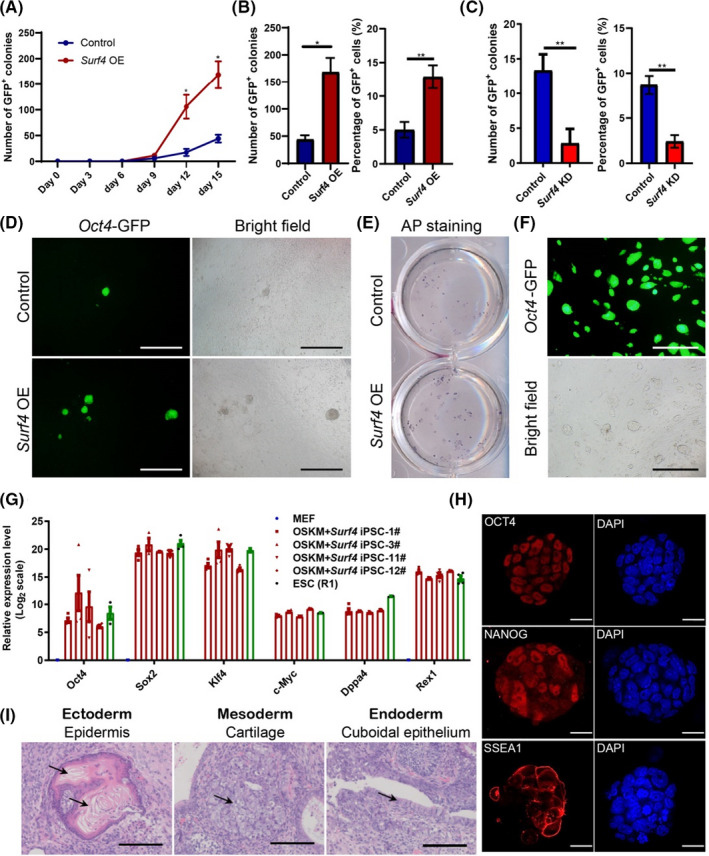
FIGURE 1.

Surf4 Promotes iPSCs Generation. (A) Kinetics of Oct4‐GFP+ colony formation with or without exogenous Surf4 during the reprogramming process (n = 3). (B) The number of Oct4‐GFP+ colonies and the percentage of Oct4‐GFP+ cells 15 days after induction induced with or without exogenous Surf4 (n = 3, *p < 0.05, by Student's t test for comparison). (C) Cell proliferation curve with or without exogenous Surf4 during reprogramming. (D) Morphology of primary iPS colonies. Scale bars, 1000 μm. Magnification: ×40. (E) Alkaline phosphatase (AP) staining of the primary iPS colonies. (F) Morphology of an established OSKM + Surf4‐iPSC cell line. Scale bars, 1000 μm. Magnification: ×40. (G) Quantitative PCR (qPCR) analysis of pluripotent genes in OSKM + Surf4‐iPSCs. The data are presented as the means ± SEM (n = 3). (H) Immunostaining of pluripotent gene products OCT4, NANOG and SSEA1 in OSKM + Surf4‐iPSCs. The nuclei were stained with DAPI. Scale bars, 50 μm. (I) Haematoxylin and eosin (H&E) staining of teratomas generated from OSKM + Surf4‐iPSCs. Scale bars, 100 μm. See also Figure S1 and Table S1
