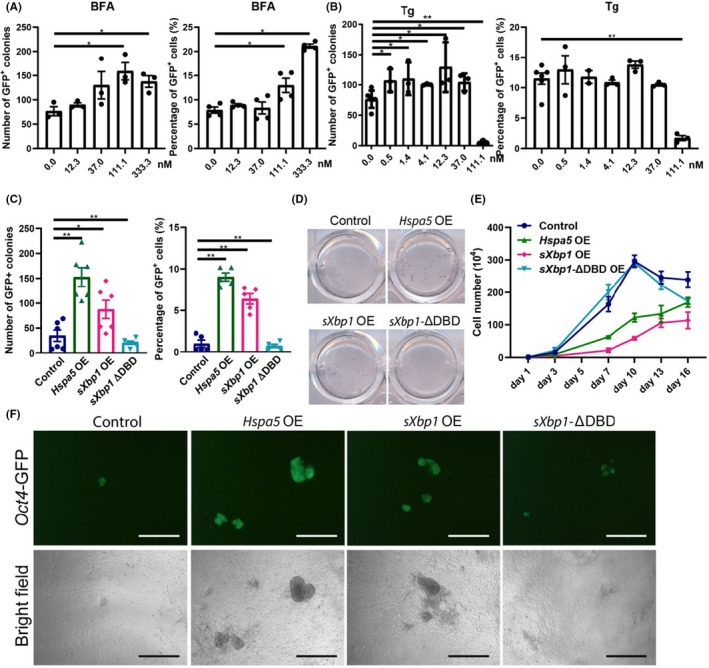
FIGURE 3.

Activation of the Response to ER Stress Facilitates Reprogramming. (A) The number of Oct4‐GFP+ colonies and the percentage of Oct4‐GFP+ cells induced by OSKM in the presence of the UPR inducer brefeldin A (BFA). The cells were seeded in 12‐well plates at a density of 1.6×10⁴ cells per well. (B) The number of Oct4‐GFP+ colonies and the percentage of Oct4‐GFP+ cells induced by OSKM in the presence of the UPR inducer thapsigargin (Tg). The cells were seeded in 12‐well plates at a density of 1.6 × 10⁴ cells per well. (C) The number of Oct4‐GFP+ colonies and the percentage of Oct4‐GFP+ cells induced by OSKM plus the effectors of UPR, Hspa5, the spliced form of Xbp1 (sXpb1) and a dominant negative form of Xbp1 (sXbp1‐ΔDBD), which lacks the DNA‐binding domain of sXbp1. (D) AP staining of primary iPS colonies induced by OSKM plus effectors of the UPR. (E) Cell proliferation curve with or without exogenous Hspa5, sXbp1 and its dominant negative mutant during reprogramming. (F) Oct4‐GFP+ represents the morphology of the primary colonies. Scale bars, 200 μm. Magnification: ×40. See also Figure S3 and Table S1
