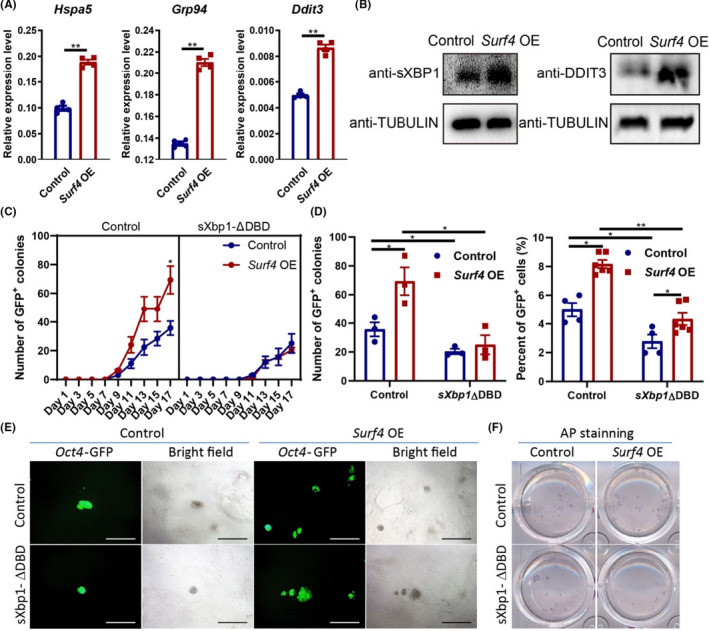
FIGURE 4.

Response to ER Stress Mediates the Reprogramming Facilitation by Surf4. (A) The RNA level of ER stress‐related genes on day 3 of reprogramming with or without exogenous Surf4. Relative expression of these genes relative to β‐actin (n = 3, average ±SEM). (B) The protein level of ER stress‐related genes on day 3 of reprogramming with or without exogenous Surf4. (C) Kinetics of Oct4‐GFP+colony formation with or without exogenous Surf4 and sXbp1‐ΔDBD during reprogramming. (D) The number of Oct4‐GFP+ colonies and the percentage of Oct4‐GFP+ cells induced by OSKM plus Surf4 and sXbp1‐ΔDBD. (E) Morphology of the primary colonies induced by OSKM plus Surf4 and sXbp1‐ΔDBD. Scale bars, 1000 μm. Magnification: ×40. (F) AP staining of the primary iPS colonies. See also Figure S4 and Table S1
