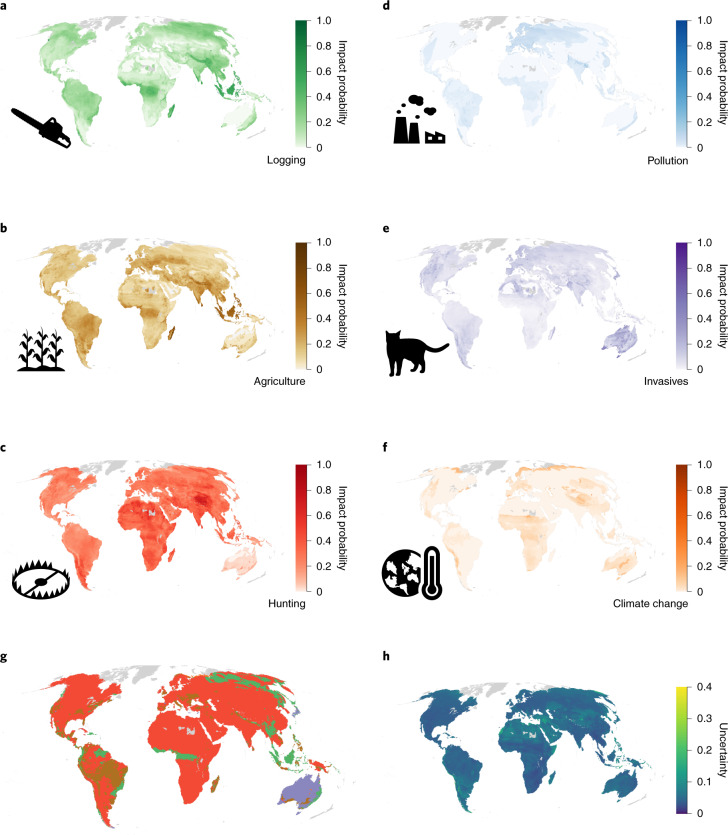
Fig. 3. Probability of impact for mammals.
a–f, Probability that a randomly selected mammal occurring in each 50 km × 50 km cell is impacted by logging (a), agriculture (b), hunting (c), pollution (d), invasive species (e) and climate change (f). Darker colours indicate higher probabilities. A value of 0 indicates that no species is affected, and 1.0 indicates that all species occurring are affected. Grey indicates areas with fewer than ten species for which the impact probability has not been estimated. g, The threat with the highest probability of impact in each cell. The colours correspond to the colour scales in a–f. h, The variability of the estimates calculated by resampling the threat classes of each species on the basis of the proportion of Data Deficient species in a given cell.

