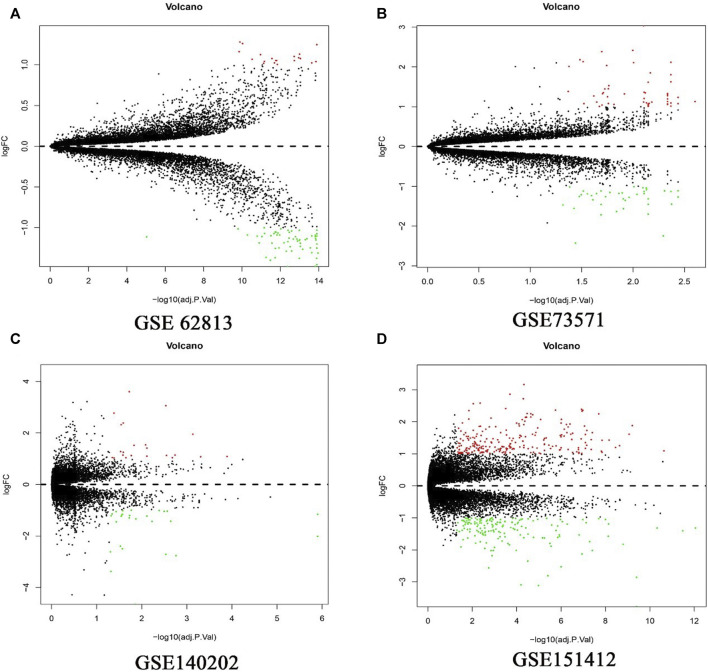
FIGURE 1.
Differential expression genes between the two groups of samples in each dataset. (A) GSE62813, (B) GSE73571, (C) GSE140202, (D) GSE151412. The red dots represent the upregulated genes and the green dots represent the downregulated genes; the black spots represent genes with no significant difference in expression level.

