
Figure 2:
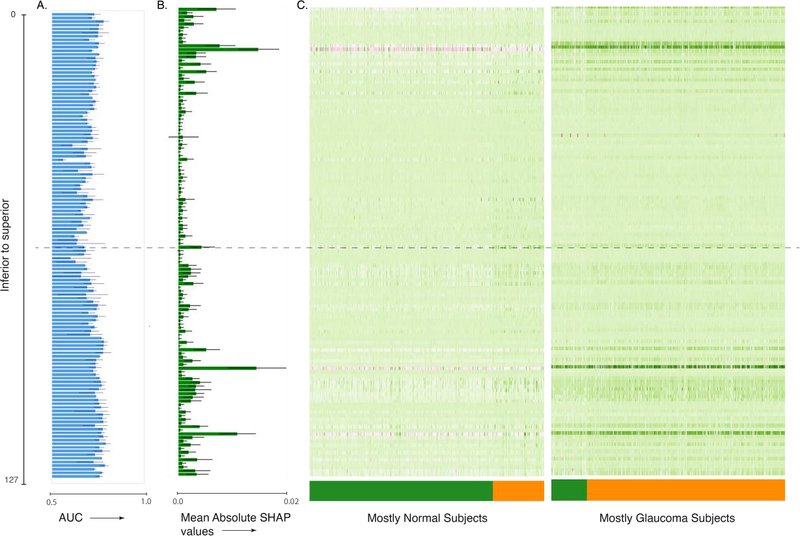
Interpretation of the ensemble model built on macular OCT images. (A) AUC for single image per retina models, (B) mean absolute SHAP values per retinal image for predicting glaucoma occurrence per retina, and (C) heat map of SHAP value per retinal image for predicting glaucoma occurrence per retina. The images are ordered from top to bottom and from superior to inferior retina. The dashed line indicates the central retinal image from the OCT volume.