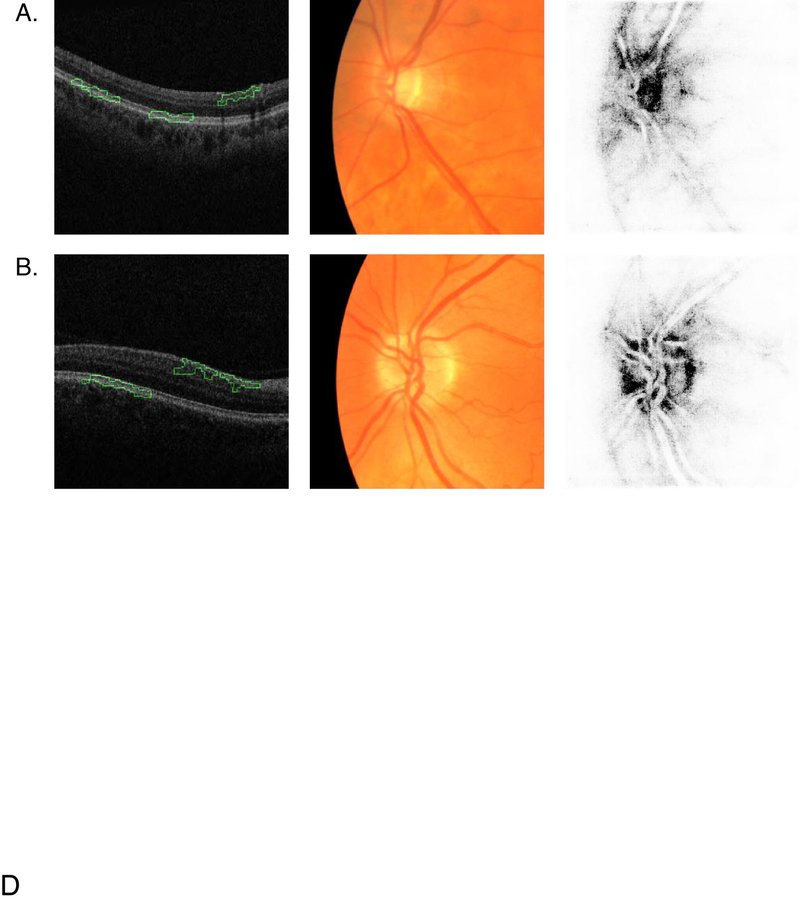
Figure 3:
Saliency maps for macular OCT and CFP. Columns left to right: macular OCT image overlaid with saliency map, cropped CFP input to the neural network, CFP saliency map. Each macular OCT image is laid out with its temporal side to the left. (A) Retina of a subject with glaucoma diagnosis. (B) Retina of healthy subject. The green outline on the OCT saliency map indicates the areas the model deems most important. The darker pixels on the CFP saliency map indicate the areas the model deems most important.

