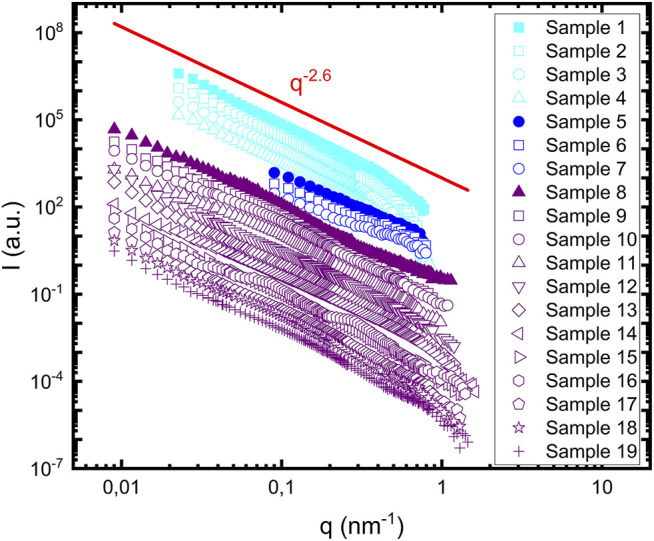
FIGURE 1.

Scattering profiles of 19 samples summarized in Table 1. Samples containing lipids are represented with open symbols. Samples 1–4 are shown in cyan, samples five to seven are shown in blue and samples 8–19 are shown in purple. Samples containing protein alone are represented with filled symbols. The red line represents the power law dependence of the scattering profile, with a power value equal to 2.6.
