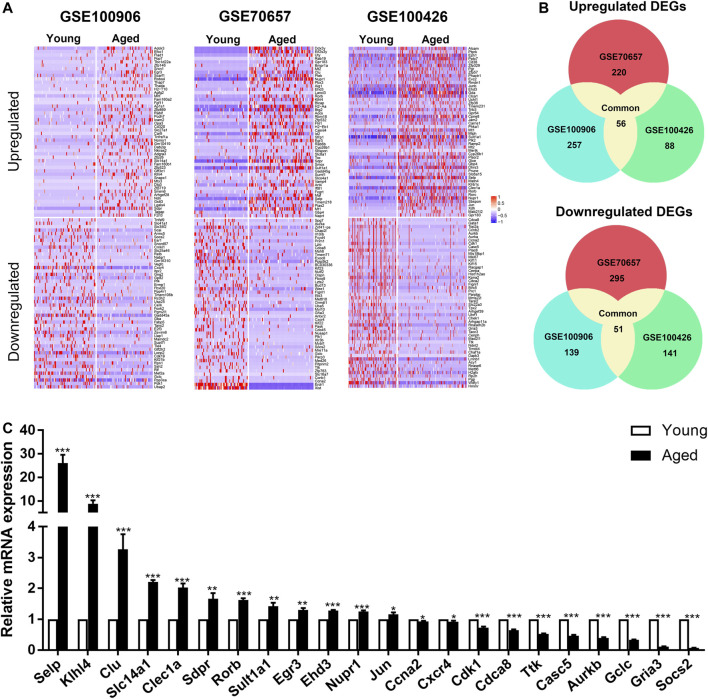
FIGURE 2.
Identification of common differentially expressed genes (DEGs) in 3 independent single-cell transcriptome datasets (GSE100906, GSE70657, and GSE100426). (A) Heatmap of the top 100 DEGs (50 upregulated and 50 downregulated genes). (B) Common DEGs in the three datasets (56 upregulated and 51 downregulated genes). (C) qRT-PCR results of the relative gene expression of top 30 DEGs. Data are presented as the mean ± SEM. *p < 0.05; **p < 0.01; ***p < 0.001.

