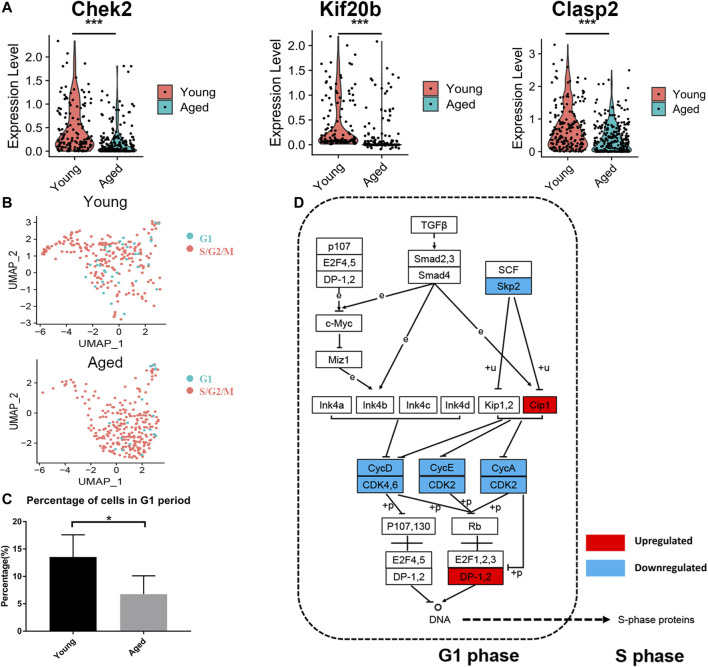
FIGURE 4.
Cell cycle analysis of HSCs. (A) Violin plot showing the expression levels of cell cycle-associated genes (Chek2, Kif20b and Clasp2) in young and aged HSCs. (B) UMAP plot for young and aged HSCs. (C) Histogram of cell frequency in the G1 cluster. Data are presented as the mean ± SEM. *p < 0.05. (D) Cell cycle pathway diagram showing alterations in signaling pathway activity. Downregulation of the Skp2-induced signaling pathway (Skp2→Cip1→CycA/CDK2→DP-1) promoted the transition from G1 phase to S phase. Upregulated genes are marked in red and downregulated genes are marked in blue.

