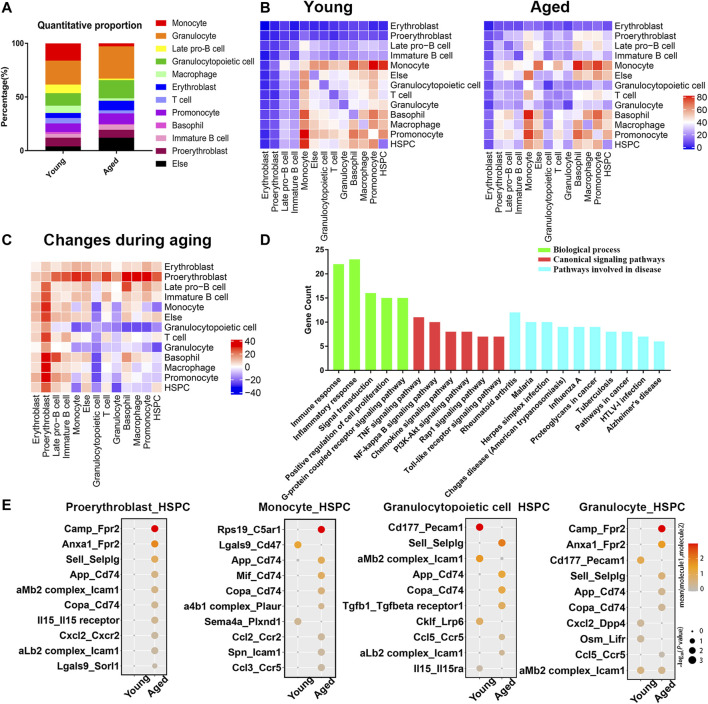
FIGURE 5.
Cellular composition and interactions between HSCs and other cell types in the bone marrow niche. (A) Quantitative proportions of different cell types in the bone marrow niche. (B) Heatmap showing the number of interactions between different cell types in young and aged bone marrow separately. (C) Heatmap showing the differences in the number of interactions (interaction number of aged cells minus the interaction number of young cells). (D) Functional enrichment results for differentially expressed ligand–receptor pairs. (E) Dot plots showing the ligand–receptor pairs between the ligand of proerythroblasts/monocytes/granulocytopoietic cells/granulocytes and the receptor of HSPCs in young and aged mice. The color of the dots represents the mean expression of each ligand and receptor, and the size of the dots represents −log10 (p value).

