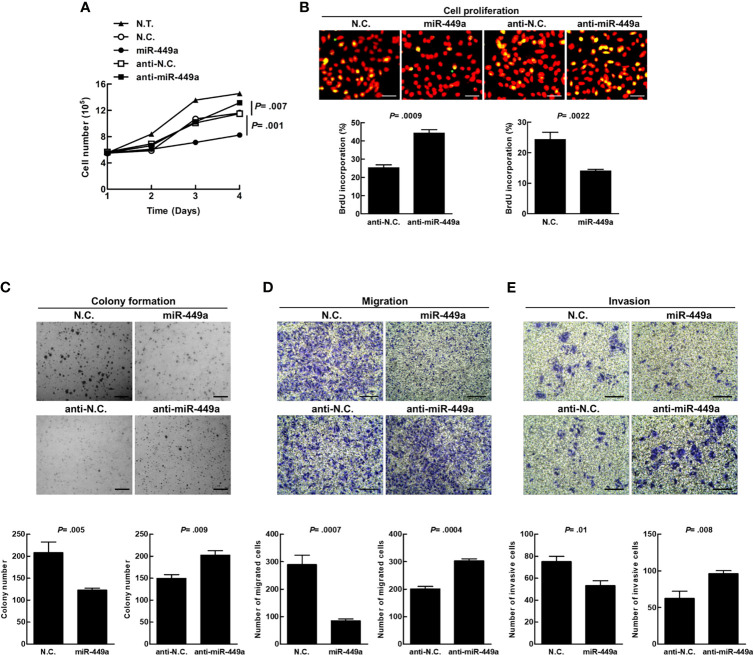
Figure 4.
MiR-449a suppresses tumorigenesis of CRC cells. The SW480 cells were transiently transfected with 100 nM of miR-449a, anti-miR-449a, or scramble control (anti-N.C.) for 48 h using Lipofectamine™ 2000 reagent. (A) Cell number was counted under a light microscope. (B) DNA synthesis was determined by BrdU (0.01 g/ml) incorporation treatment of SW480 cells for 30 min. Anti-BrdU antibody and propidium iodide (PI) were used to label the treated cells for DNA synthesis and nuclei, respectively. The yellow fluorescent cells represent proliferating cells (DNA synthesis), which were counted under three random fields under a fluorescent microscope and were used to calculate the percentage of cell proliferation. (C) A total of 2×10⁴ transfected cells were plated on the soft agar in a 6-well plate. The images were taken 14 days after plating. The diameter of a counted colony bigger than 0.1 mm at 9X magnification was defined as positive colony. Scale bar= 1 mm. (D) In the migration assay, transfected cells were seeded in the Transwell™ permeable insert with FBS-free medium in the lower chamber. The migrated cells were counted after 48 h. (E) In the invasion assay, the transfected cells were seeded into the Transwell™ insert coated with the matrigel. The number of invasive cells was counted after 72 h. The cells were counted under three random fields under a light microscope. Quantification was conducted based on three independent experiments. The p values were determined by Student’s t-test analysis. Scale bar= 100 μm.

