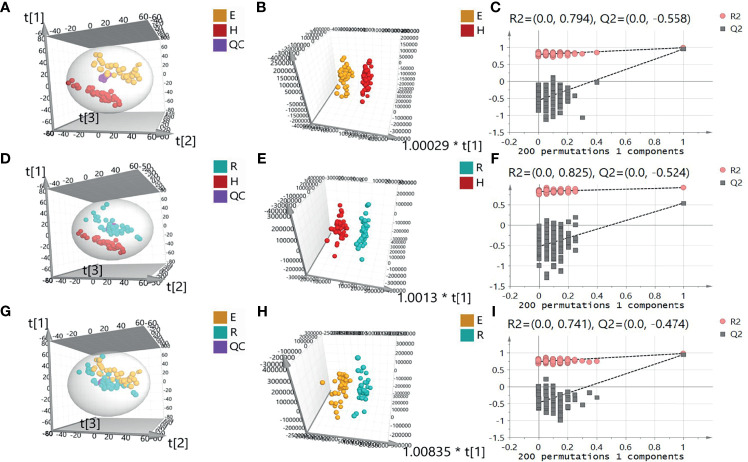
Figure 2.
Principal component analysis (PCA) diagram of serum samples of EOLP group and HC group (A), ROLP group and HC group (D), EOLP group and ROLP group (G) in the negative ion mode, OPLS-DA score diagram (B, E, H) and 200 permutation test (C, F, I) of EOLP group and HC group, ROLP group and HC group, EOLP group and ROLP group in the negative ion mode. E: EOLP; R: ROLP; H: HC.

