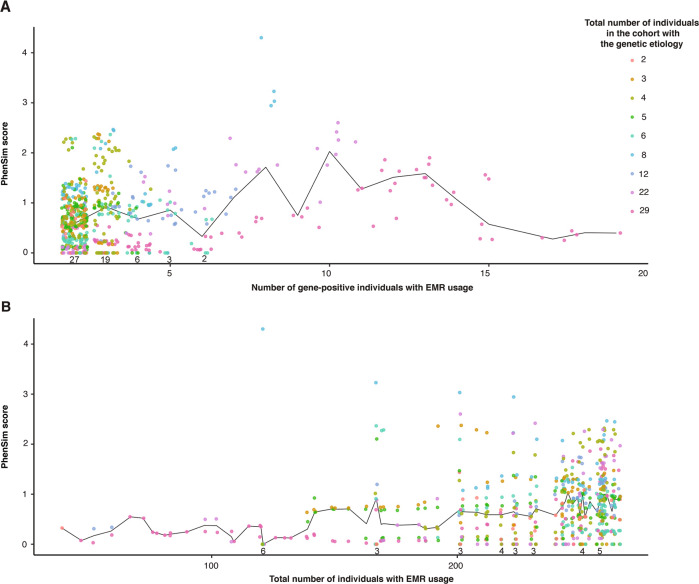
Fig. 3. The relationship between PhenSim and the number of individuals with EMR usage at the corresponding age.
The effect of the number of (A) gene-positive and (B) total individuals with EMR usage on PhenSim scores at the corresponding age. The number of etiologies with PhenSim scores of zero at each number of gene-positive individuals where this was observed is shown above the x-axis in (A). The median PhenSim score for each value on the x-axes is shown by the black lines.

