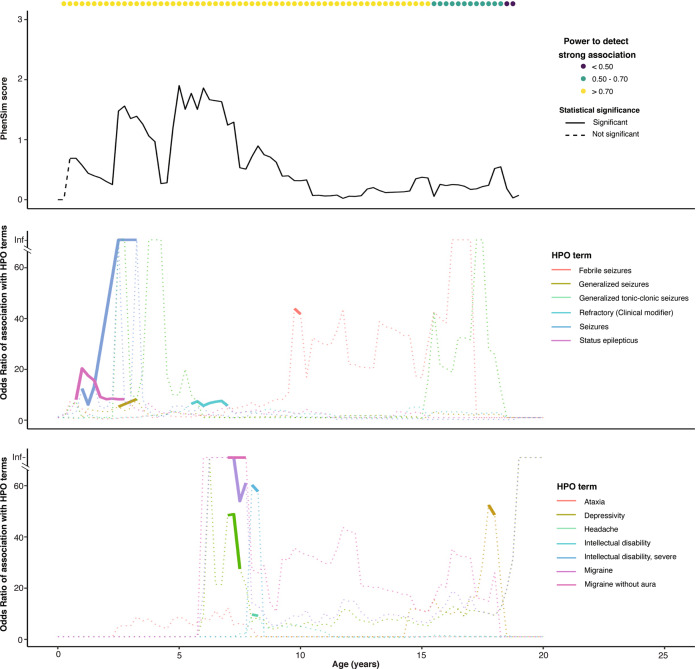
Fig. 4. The relationship between strong associations with single phenotypic terms and phenotypic similarity according to age for SCN1A.
Associations are shown only for terms reaching a strong association at any given age. Associations are plotted as solid lines at ages with a p-value < 0.01 and as a dotted line at ages where p-value > 0.01. PhenSim scores are shown as solid lines where significant after Holm’s adjustment and dashed lines where not.

