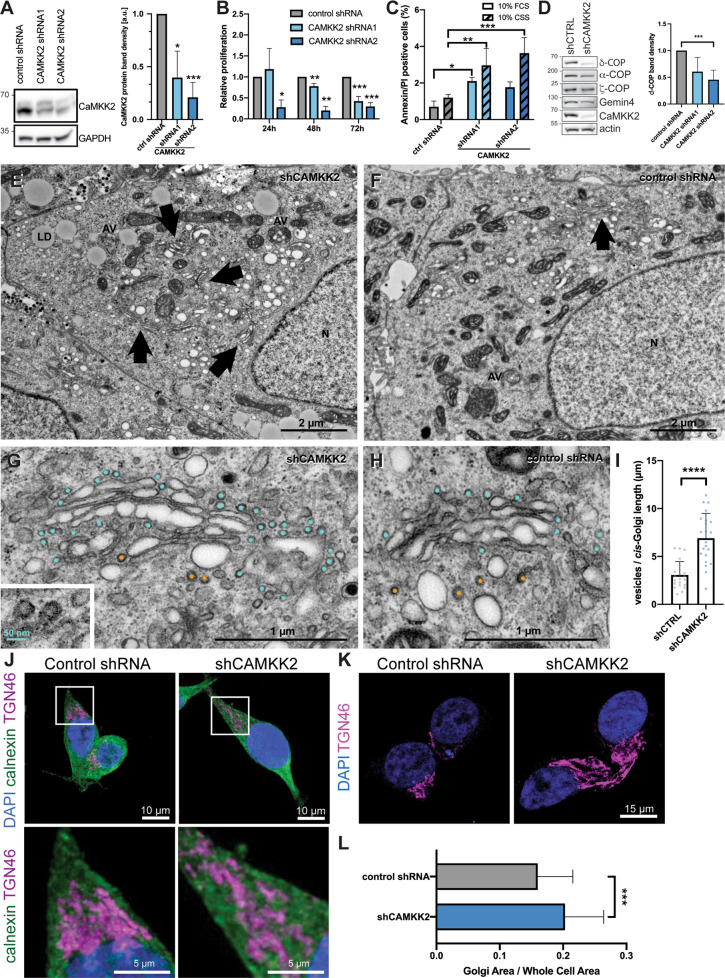
Fig. 3. CaMKK2 regulates Golgi morphology.
A Representative western blot of cell lysates from two CaMKK2 knockdown LNCaP cell lines. The efficiency of knockdown was quantified relative to GAPDH loading control. Mean ± SD; n = 3; *P = 0.0140; ***P = 0.0006. B Proliferation assay of LNCaP CaMKK2 KD in steady state conditions at 24, 48 and 72 h. Mean ± SD; n = 3; *P < 0.05; **P < 0.01; ***P < 0.001. C Percentage of Annexin V and PI-positive cells present in LNCaP KD following 72 h in 10% foetal calf serum (FCS) or 10% charcoal-stripped serum (CSS) serum assessed by flow cytometry. Mean ± SD; N = 3; *P < 0.0170, **P < 0.006, ***P < 0.0008. D Representative western blots of steady-state level COPI and Gemin4 protein levels in CaMKK2 knockdown (shRNA2) LNCaP cells. Densitometry values for δ-COP were generated in ImageJ relative to loading control. N = 3 for shRNA1 and N = 4 for shRNA2; P = 0.0281 for CAMKK2 shRNA1 and ***P = 0.0009 for CAMKK2 shRNA2 compared to control. E, F Transmission electron microscopic (TEM) images from CAMKK2 knockdown (shRNA2) and control LNCaP cells grown in regular media showing morphological differences in Golgi network (arrows), lipid droplets (LD) and autophagic vesicles (AV). N denotes nucleus. Scale bars 2 µm. G, H Electron micrographs of control and CaMKK2-depleted LNCaP cells showing the Golgi apparatus at higher magnification. Clathrin-coated membrane buds are marked in orange and non-clathrin-coated vesicles, presumably COPI coated, are marked in cyan. Inset shows COP-coated membrane buds; scale bar 50 nm. Scale bars 2 µm. I Quantification of vesicles per length of cis-Golgi membrane. Mean ± SD; n = 22; ****P < 0.0001. J Immunostaining of TGN46 (Golgi) in magenta showed a more dispersed distribution in the LNCaP CAMKK2 shRNA2 cell line compared to control. Endogenous calnexin (green) shows the endoplasmic reticulum. Scale bar = 10 µm. Boxed inlays are shown below. Scale bar = 5 µm. K Representative images showing maximal projections from z-stack confocal series of TGN46 (magenta) and DAPI (blue). L Quantification of the Golgi area normalised to the whole-cell area show an increase in Golgi area in CAMKK2-deficient cells. Sixty-two cells were quantified across three replicates for each cell line. Mean ± SD; ***P = 0.0004.

