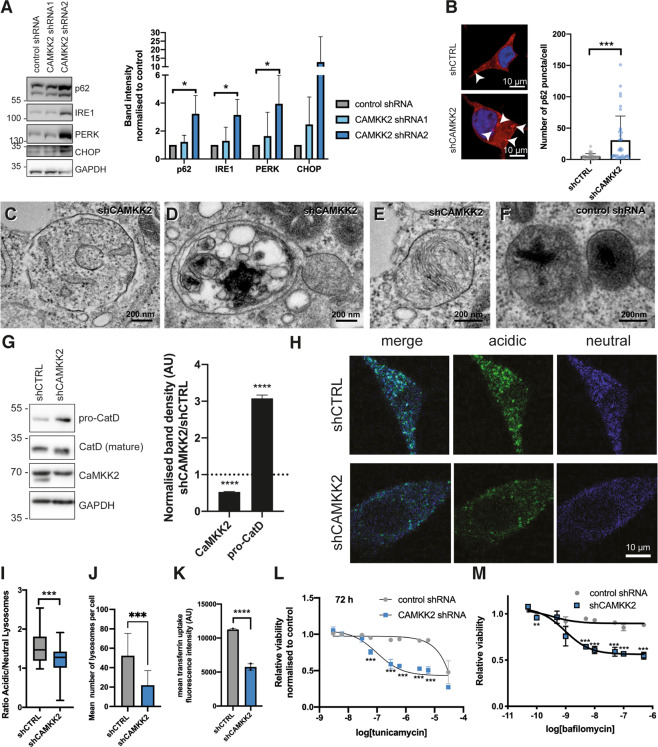
Fig. 5. Loss of CaMKK2 results in ER stress and an increased sensitivity to a lysosomal acidification inhibitor.
A Representative western blot of unfolded protein response (UPR) and autophagy proteins: p62, IRE1, PERK, CHOP, in CAMKK2 knockdown LNCaP cell lysates. Densitometry was normalised to loading control for each sample. N = 3 for IRE1 and N = 4 for PERK and LC3. Mean ± SD; *P < 0.05. B Representative confocal images of control and CAMKK2 knockdown (shRNA2) LNCaP cells stained for p62 and DAPI. The number of p62 puncta (arrow heads) were analysed in 35 cells across 3 replicates. Mean ± SD; ***P = 0.0002. Scale bar = 10 µm. C, D Representative transmission electron microscopic (TEM) images of CAMKK2 knockdown (shRNA2) LNCaP cells showing autolysosomes including hemi-fused autophagosome-lysosome structures. Scale bars 200 nm. E, F Representative TEM images showing the lysosome morphology in CAMKK2 knockdown (shRNA2) and control shRNA cells. Scale bars 200 nm. G Quantification of uncleaved pro-Cathepsin D in cell lysates from control and CAMKK2 knockdown (shRNA2) cells by western blotting. Graph displays values from shCAMKK2 normalised to the control knockdown, mean ± SD, N = 3, P < 0.0001. H Representative multiphoton live cell images of LNCaP cells stably expressing control or CAMKK2-targeting shRNA and stained with Lysosensor DND-160. Scale bar 10 µm (for all images). I Quantification showing the ratio of acidic:neutral lysosomes using CTFC values for blue/green channels. Thirty-eight cells were analysed across three replicates. The box and whisker plot show 5–95 percentile with the mean indicated with a line; ***P = 0.0002. J The mean number of lysosomes per cell were quantified from the Lysosensor DND-160 data. Mean ± SD for 15 cells in three replicates; ***P = 0.0002. K Uptake of Alexa647-transferrin for 10 min was measured to investigate the endocytosis of the transferrin receptor. Samples were analysed by a FACS assay showed a significant reduction compared to control in the CaMKK2 knockdown LNCaP cell line. The bar graph shows mean with SD, N = 3 with 3 technical repeats per experiment that each analysed the mean fluorescence of 10,000 cells. ****P < 0.0001, two-way ANOVA. L A viability assay showing the tunicamycin dose response at 24, 48 and 72 h in LNCaP control and CaMKK2 knockdown. Mean ± SD; *P < 0.05; **P < 0.01; ***P < 0.001. M A viability assay showing the response of CaMKK2 shRNA2 LNCaP cells to increasing concentrations of Bafilomycin A1 dose at 72 h normalised to control. Mean ± SD; **P < 0.01; ***P < 0.001.

