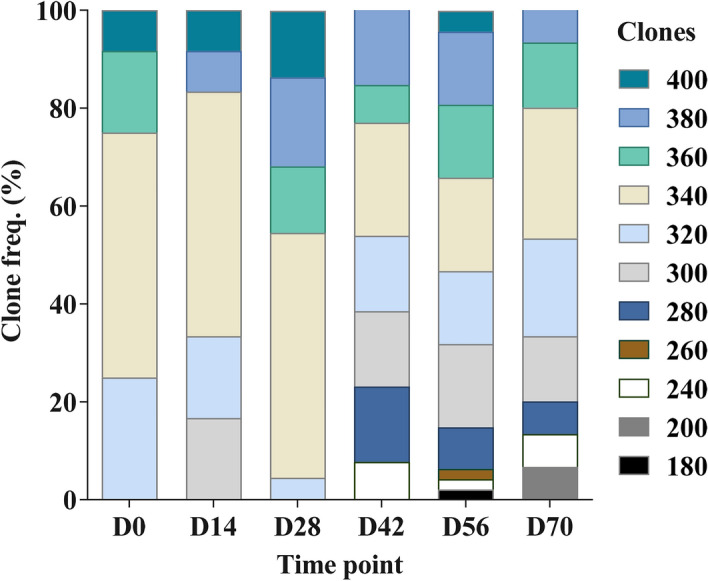
Figure 2.

Distribution and duration of circulating gametocyte clones. At each time point analyzed [Day (D)] the different gametocyte clones (n = 11) detected in the subpopulation (n = 149) of infected samples tested are shown. Clonal frequency and distribution differed between time points. The highest number of diverse clones were observed on days 56 and 70. Clones below 300 bp (180–280) were least represented and observed only after day 28.
