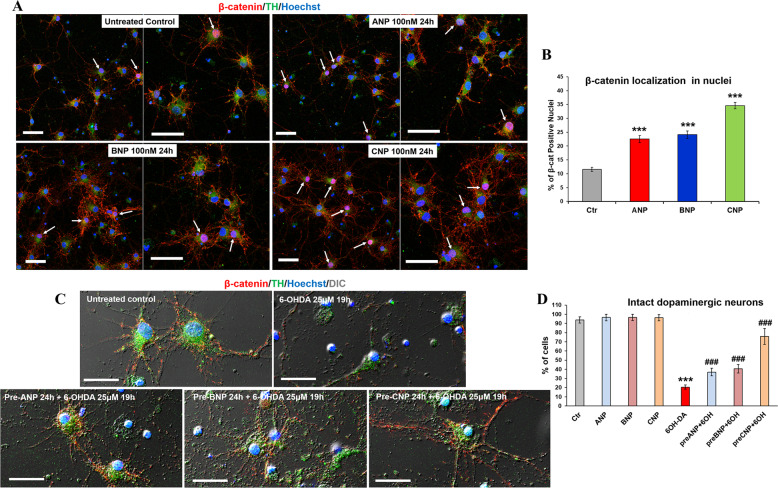
Fig. 4. BNP and CNP induce β-catenin nuclear translocation and exhibited protective ability against 6-OHDA induced toxicity in primary cultures of DA neurons.
A Confocal microscopy images showing the intracellular distribution of β-catenin (red hue) in control and NPs treated DA neurons (TH positive; green hue) after 24 h of culture. Merged images of β-catenin/TH double immunofluorescent staining and nuclei counterstaining with Hoechst (blue hue) are shown. Arrows point to β-catenin positive nuclei in TH-positive cells. Bars 50 µm. B Quantitative evaluation of the percentage of TH-positive cells exhibiting nuclear β-catenin, in untreated and NPs treated cultures. Data were obtained by counting a minimum of 300 cells/samples and results showed are the mean ± SD from three independent experiments (n = 3). Significance vs. untreated control (one-way ANOVA test + Tukey post-test): ***p < 0.001. C Confocal microscopy of primary DA neurons exposed to 25 µM of 6-OHDA for mimicking the neurodegeneration of PD. To assess the neuroprotective ability of NPs against 6-OHDA induced cytotoxicity, cells were pre-treated with 100 nM of the hormones 24 h prior to the neurotoxin challenge. Double immunofluorescent staining of β-catenin (red hue) and TH (green hue) was performed. Nuclei were visualized by Hoechst counterstaining (blue hue). Merged images with differential interference contrast (DIC), used for visualizing cell morphology, are shown. Bars: 25 µm. D Quantitative evaluation of the percentage of intact dopaminergic cells in primary cultures subjected to neurotoxin insult in presence of NPs and in those challenged in NPs-free medium. Data from untreated control or cells treated with NPs in absence of neurotoxin insult are also reported. A minimum of 300 nuclei/samples were counted and the results showed are the mean ± SD from three independent experiments (n = 3). Significance (one-way ANOVA + Tukey multiple comparison tests): *vs. untreated control (CTR), #vs. 6-OHDA; ***p < 0.001; the mean ± SD; n = 3. Additional results from the one‐way ANOVA test used to analyze the differences between groups are reported in Supplementary Data.

