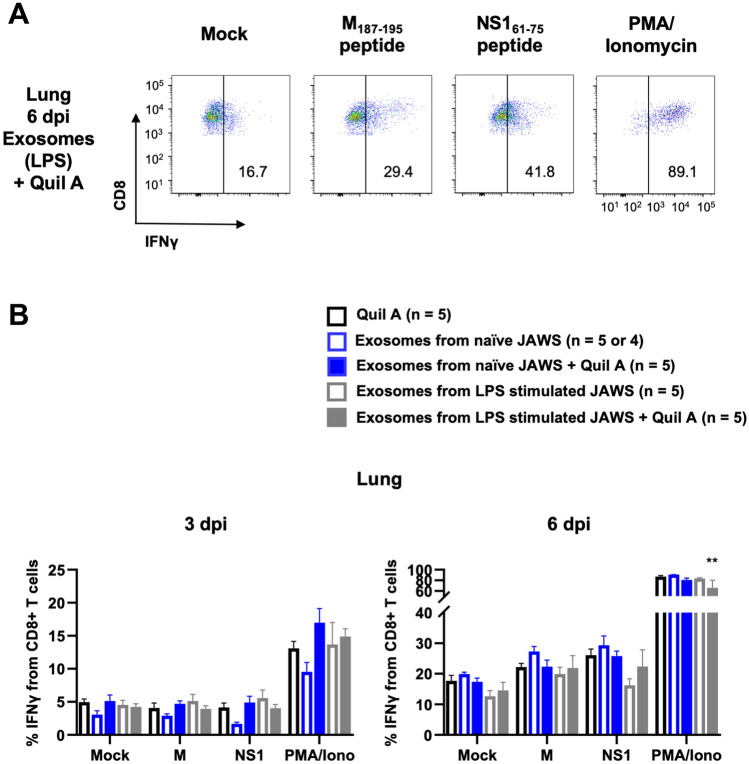
Figure 4.
The production of IFN-γ by M187–195 or NS161–75-specific T cells in the lungs. Groups of vaccinated mice were sacrificed either 3 or 6 days post-infection (dpi). Their lungs were stained with antibodies and analyzed by flow cytometry. (A) Representative flow cytometry plots showing IFN-γ producing lungs from a group of exosomes from LPS stimulated JAWS with Quil A at 6 dpi of RSV after stimulation with M187–195 or NS161–75 peptides. (B) Flow cytometric analysis of IFN-γ production by lungs in the CD45+ CD8+ T cell population after stimulation with the indicated conditions. Data are presented as means ± SEM. **p < 0.01 as determined by two-way ANOVA and Tukey's multiple comparisons test.

