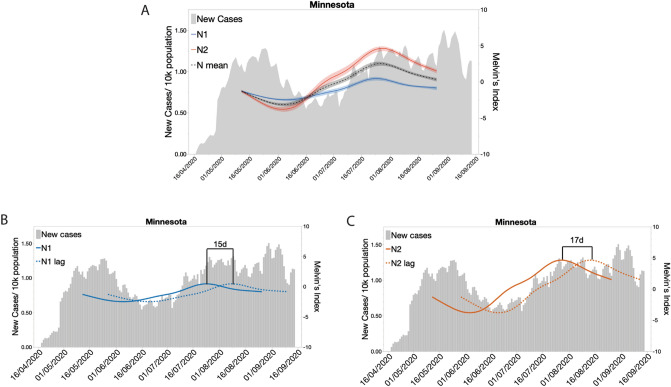
Figure 3.
Indexed SARS-CoV-2 levels in wastewater trends across the state show a similar pattern to new cases per capita with a temporal offset. (A) New daily clinical cases of COVID-19 overlayed by the indexed SARS-CoV-2 N1, N2, and the mean of N1 and N2 data from RT-qPCR analysis of wastewater samples collected across the state of Minnesota from May to September. (B) Correlation and lag analysis of wastewater SARS-CoV-2 N1 levels with new daily clinical cases of COVID-19 for the state of Minnesota. (C) Correlation and lag analysis of wastewater SARS-CoV-2 N2 levels with new daily clinical cases of COVID-19 for the state of Minnesota.

