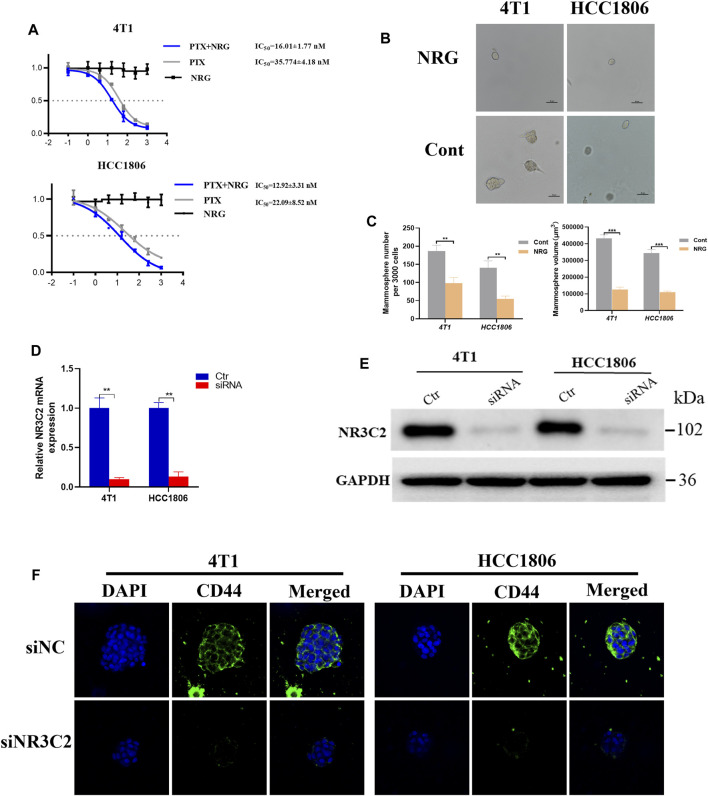
FIGURE 8.
Effect of naringenin and NR3C2 on stem cell colony formation of TNBC cells. (A) 4T1 and HCC1806 cells were treated with 0, 0.1, 1, 4, 16, 64, 256, and 1024 nM PTX with or without 0, 0.1, 1, 4, 16, 64, 256, and1024 nM naringenin or 0, 0.1, 1, 4, 16, 64, 256, and1024 nM naringenin only for 48 h, respectively. The MTT assay was used to detect the viability of the cells (naringenin compared to control). (B,C) Representative photomicrographs of mammospheres formed by 4T1 and HCC1806 cells treated with naringenin and DMSO (Cont) are displayed. The quantification of the mammospheres number and size is presented as mean ± SD of three parallel experiments. Statistical analysis was conducted using two-way ANOVA. (D,E) RT-PCR and WB outcomes presented that the knockdown of NR3C2 caused decreasing protein expression levels of the mineralocorticoid receptor (MCR). *p < 0.05, **p < 0.01, ***p < 0.001 vs control. (F) Representative immunofluorescent images for siNC and siNR3C2 TNBC cells for CD44 (green) and DAPI (blue) signals.

