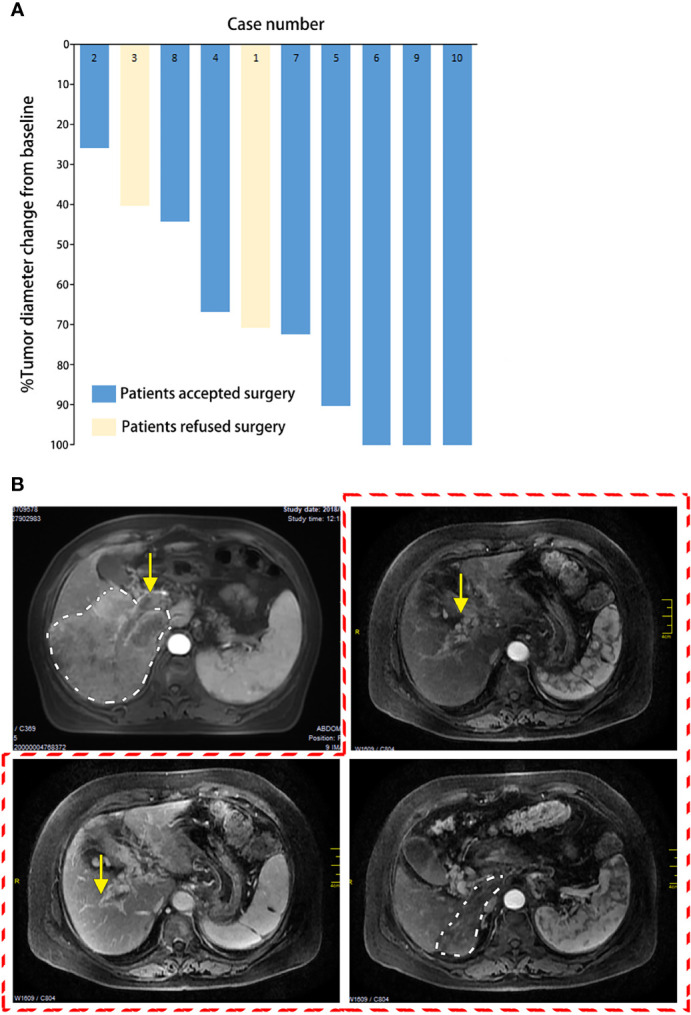
Figure 1.

Tumor shrinkage after the conversion therapy. (A) Waterfall plot of maximum tumor shrinkage based on the modified response evaluation criteria in solid tumors (mRECIST) per independent imaging review. (B) Radiologic change of case no. 1. Before treatment (first image outside the red dotted line): tumor located in the right liver (outlined in white dotted line) and portal vein tumor thrombus (PVTT) in the right portal vein (yellow arrow). After treatment (outlined in red dotted line): tumor shrinkage (outlined in white dotted line), future liver remnant (FLR) enlargement, cavernous transformation of portal vein, and recanalization of the intrahepatic portal vein (yellow arrow).
