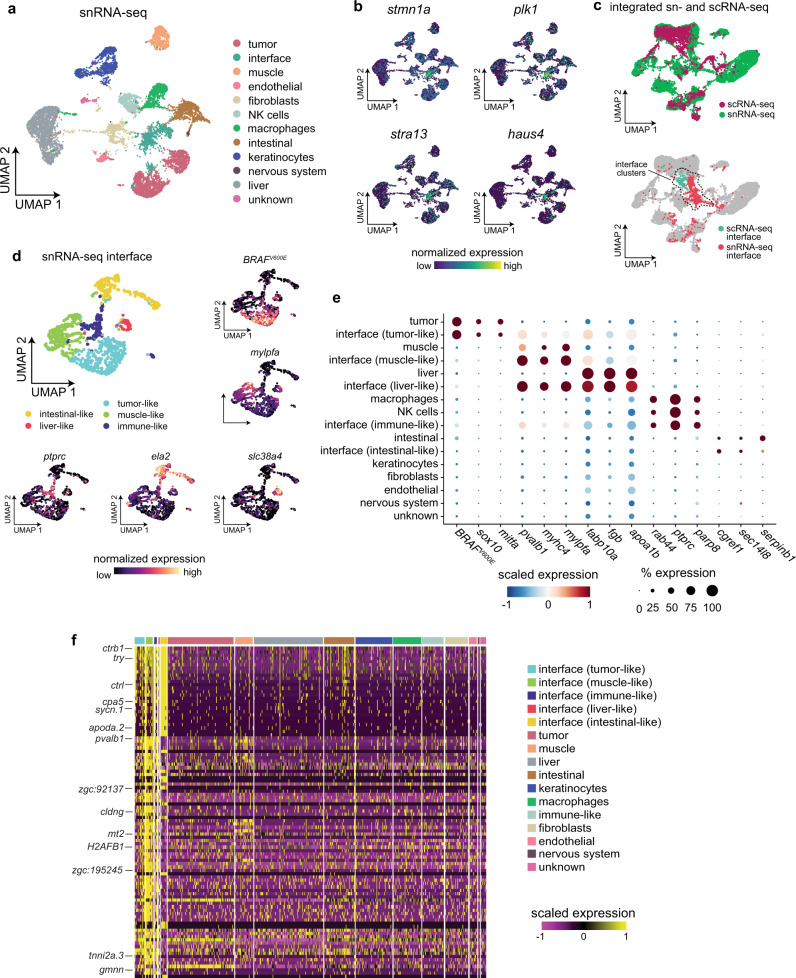
Fig. 4. Single-nucleus RNA-seq demonstrates that the interface cell states are distinct from the rest of the microenvironment.
a snRNA-seq cluster assignments plotted in UMAP space. b Expression of marker genes from the scRNA-seq interface cluster in the snRNA-seq dataset. c Integrated UMAP of the snRNA-seq and scRNA-seq datasets (labeled, top plot) showing colocalization of the two interface clusters (bottom plot). d Subcluster assignments and expression of marker genes from the snRNA-seq interface cluster. e Dotplot showing expression of microenvironment cell-type specific genes within the interface subclusters. f Heatmap showing expression of the top 100 genes upregulated across all of the interface subclusters.

