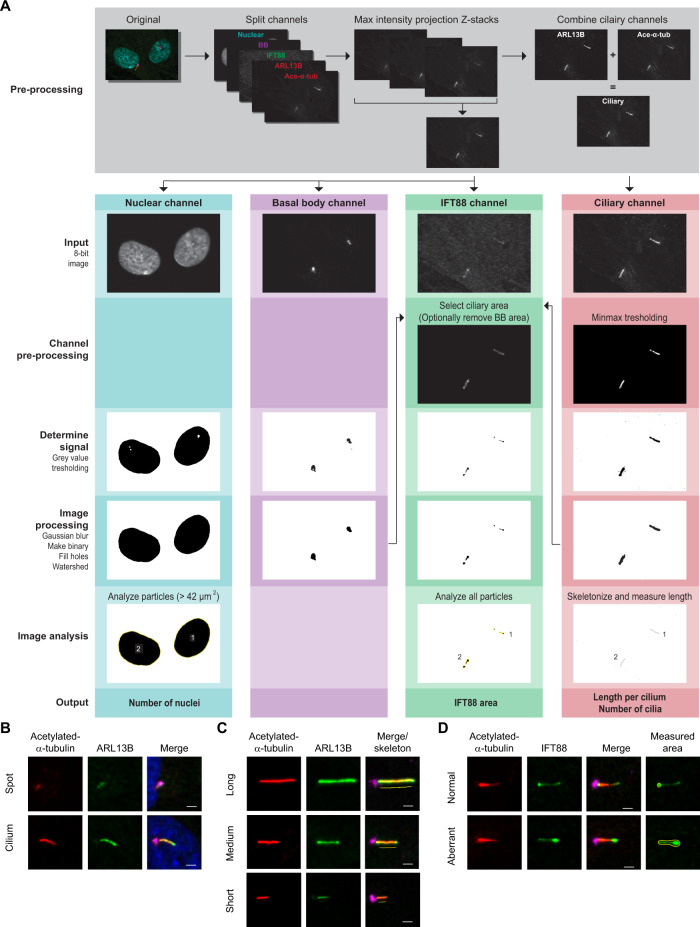
Fig. 1. Explanation of ALPACA and cilium phenotype parameters in fibroblasts.
A Images are pre-proccessed and the split channels are processed and analyzed seperately. To generate the output, the two ciliary channels (ARL13B and acetylated-α-tubulin) are combined to measure cilium length. The number of nuclei and cilia per image are combined to calculate the percentage of ciliated cells. The basal body (BB), ciliary, and IFT channels are used to obtain the area stained for IFT88 within the cilia. B Ciliogenesis indicates the percentage of ciliated cells. Cilium axoneme is visualized with acetylated-α-tubulin (red) and ARL13B (green), the base of the cilium is marked with PCNT (pink), and nuclear material with DAPI (blue). C The cilium length measurements are based on the combined signal of acetylated-α-tubulin (red) and ARL13B (green). The base of the cilium is marked with PCNT (pink). D Retrograde transport is indirectly measured by calculating the surface area of IFT88 (green) at the ciliary tip. The ciliary axoneme is visualized with acetylated-α-tubulin (red) and the base of the cilium is marked with PCNT (pink). Aberrant retrograde transport is illustrated with a cilium showing an increased IFT88 tip surface area compared to a normal cilium tip area. The scale bar indicates 2 µm.

