Figure 1.
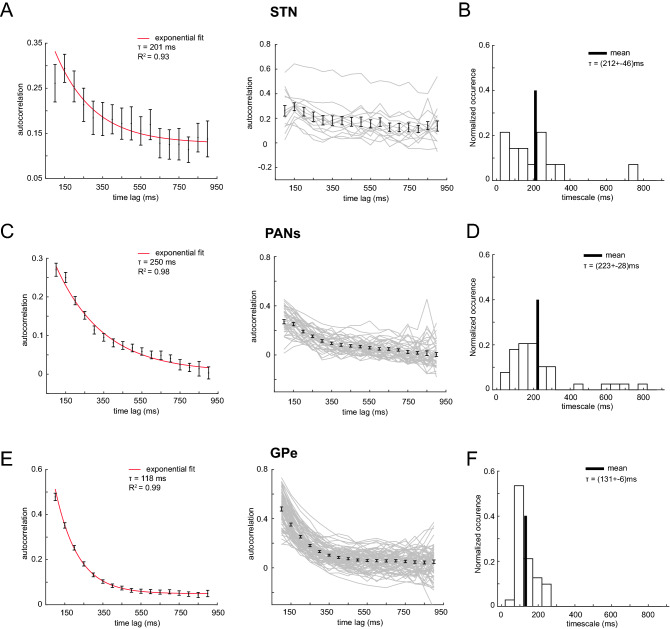
Mean autocorrelation values and single timescale distribution. (A) Left Panel: mean autocorrelation averaged across all neurons (n = 14) recorded in the subthalamic nucleus (STN) using 50 ms time bins in a 900 ms time window during the baseline period (mean ± SEM). The solid red line is the exponential fit. The autocorrelation at 50 ms has been excluded from the fit procedure. The intrinsic timescale τ is shown in the top right corner, with the R2 value as a goodness of fit estimator. Right panel: single neuron autocorrelation structure (grey lines) with the mean and standard error bar for each time lag (black bars). (B) Single neuron timescale distribution for STN (n = 14) computed in the same baseline period as in the population timescale shown on the left panel. The solid line is the mean. The mean of the timescale distribution is shown in the top right corner with the standard error of the mean. The median of the distribution is 178 ms, while the mode gets two values, 50 ms and 200 ms. (C) Left Panel: mean autocorrelation averaged across neurons (n = 39) recorded in phasically active neurons (PANs) of the striatum in the same baseline period as (A). The autocorrelation value at 50 ms has been excluded from the fit procedure as in A). Right panel: same as in (A) right panel. (D) Single neuron timescale distribution for PANs (n = 39). The median of the distribution is 181 ms, while the mode gets two values, 50 ms and 150 ms. (E) Left Panel: mean autocorrelation averaged across neurons (n = 71) recorded in the external globus pallidus (GPe) in the same baseline period as (A) and (C). The autocorrelation values at all time lags have been included in the fit procedure. Right panel: same as in (A). (F) Single neuron timescale distribution for GPe neurons (n = 71). The median and mode of the distribution are 115 ms, and 100 ms, respectively.

