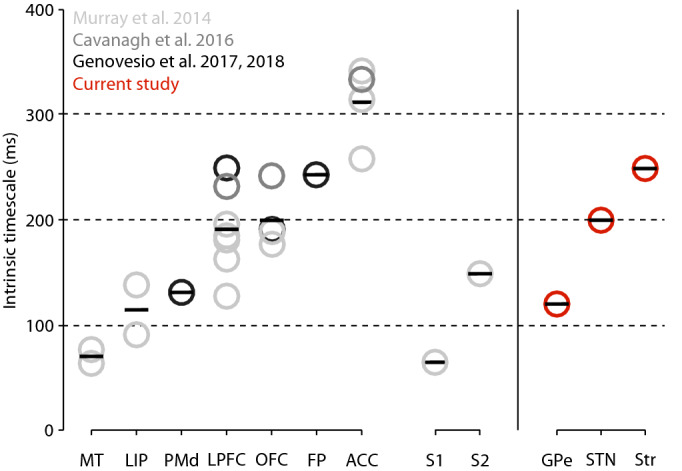
Figure 2.

Hierarchical organization of intrinsic timescales of cortical and subcortical structures. Left Panel: Intrinsic timescales of nine cortical areas reported by4 in light gray, by20 in medium gray, and by6,21 in dark gray. The seven areas on the left (MT, LIP, PMd, LPFC, OFC, FP, and ACC) are part of the visual and prefrontal cortices. The two areas on the right are part of the somatosensory cortex (S1, S2). Each circle represents the average τ for each cortical area reported in each study. Each bar represents the average τ among the studies. Right Panel: Same representation for the three subcortical structures (GPe, STN, and striatum) analyzed in the present study. ACC, anterior cingulate cortex; FP, frontopolar cortex; GPe, external globus pallidus; LIP, lateral intraparietal cortex; LPFC, lateral prefrontal cortex; MT, medio-temporal area (of visual cortex); OFC, orbitofrontal cortex; PMd, dorsal premotor cortex; S1, primary somatosensory cortex; S2, secondary somatosensory cortex; STN, subthalamic nucleus.
