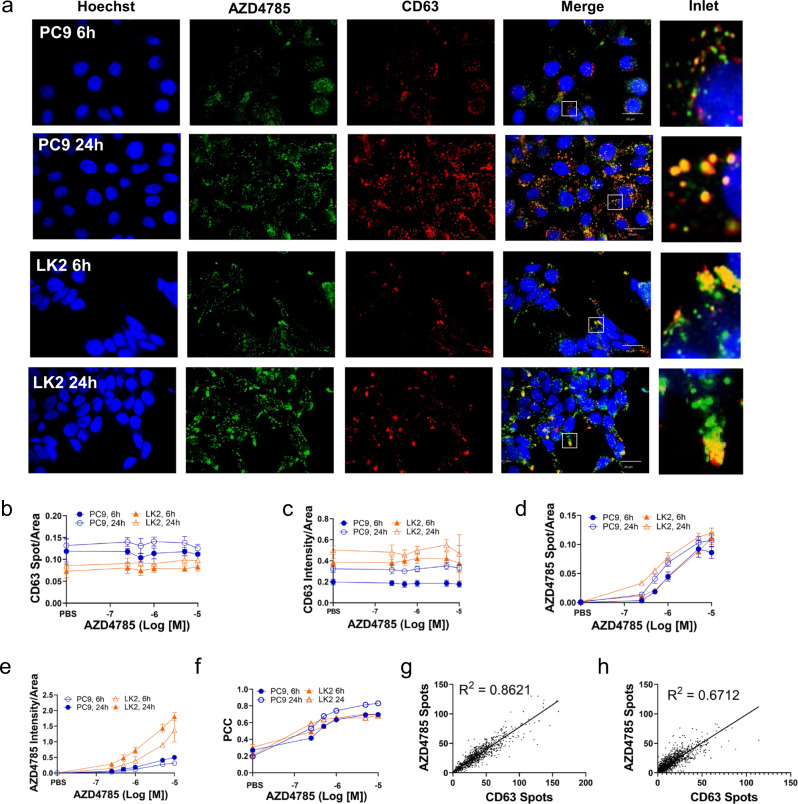
Fig. 1. AZD4785 is delivered to the CD63-positive LE compartment in PC9 and LK2 cells.
a PC9 and LK2 cells were incubated with AZD4785 for 6 or 24 h, then fixed and stained. LE and AZD4785 were stained with anti-CD63 and anti-PS-ASO antibodies, respectively and visualised using secondary fluorescently labelled antibodies. Nuclei were stained with Hoechst 33342. Cell images were acquired using Opera microscope (×60 objective, NA1.4). b–e Intracellular content of AZD4785 and CD63 were quantified by using Columbus software by counting number of stained spots in the cell cytosol (Spot/Area) or integrated intensity (Intensity/Area). Number of spots and integrated intensity were normalised to the cellular cytosol area. Average of means, error bars, standard deviation. Minimum 300 cells for each condition were counted in each experiment (N = 3–6). f AZD4785 and CD63 colocalisation were calculated by Pearson’s correlation coefficient (PCC). N = 3, error bars, standard deviation (SD). g Correlation between intracellular AZD4785 and CD63 spots in single PC9 cells. 24 h treatment with AZD4785. N = 3, n = 948 cells. Linear regression analysis. h Correlation between intracellular ASO and CD63 spots in single LK2 cells. 24 h treatment with AZD4785. N = 3, n = 1759 cells. Linear regression analysis.

