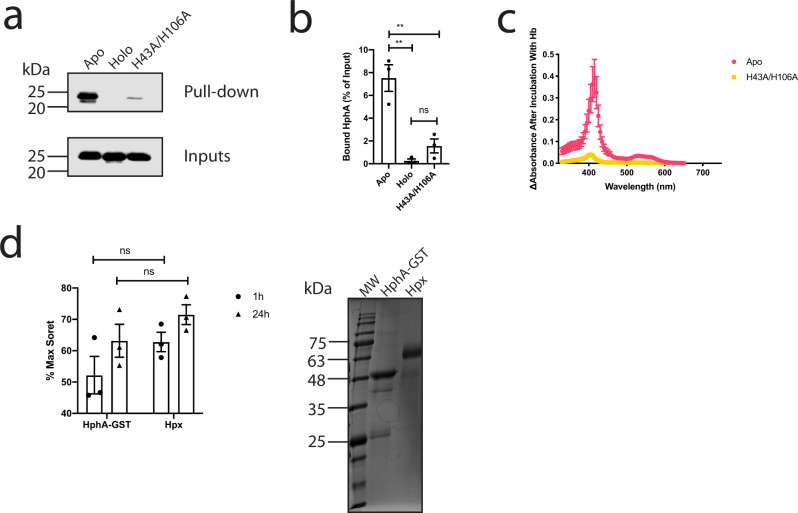
Fig. 3. HphA interacts with hemoglobin and passively acquires heme.
a HphA pull-down showing binding of HphA to hemoglobin (Hb) resin. A representative anti-His Western from three distinct experiments is shown. Inputs represent a tenth of the protein used in the assay. b Quantification of average HphA band intensity normalized to input ± standard error of the mean from three independent pull-down experiments, a representative of which is shown in (a). Statistical significance determined by one-way ANOVA followed by Tukey’s test. ns P ≥ 0.05, **P < 0.01. Adjusted P values are as follows: apo vs. holo P = 0.0013, apo vs. H43A/H106A P = 0.0037, holo vs H43A/H106A P = 0.4949. c The presence of heme bound HphA was detected by visible spectroscopy following incubation of apo-HphA with hemoglobin resin. The plotted curves represent the mean difference before and after incubation with beads ± standard error of the mean from three independent experiments. d GST tagged HphA and hemopexin (Hpx) were incubated with Hb beads to determine if heme stealing is passive. The change in Soret signatures, averaged over 413–415 nm and 414–415 nm for Hpx and HphA, respectively, were normalized to the protein concentration determined by Bradford assay and expressed as a percent of the max Soret signal determined by incubating an equal molar ratio of protein with hemin. Values plotted represent the average ± standard error of the mean from three different experiments. Note that the same max Soret signal and protein absorbance before incubation with Hb resin were used for normalization for all three experiments. Statistical significance determined by two-tailed unpaired student t-tests. Coomassie blue-stained SDS-PAGE gel of Hpx and purified HphA-GST (~50 kDa) is shown to the right.

