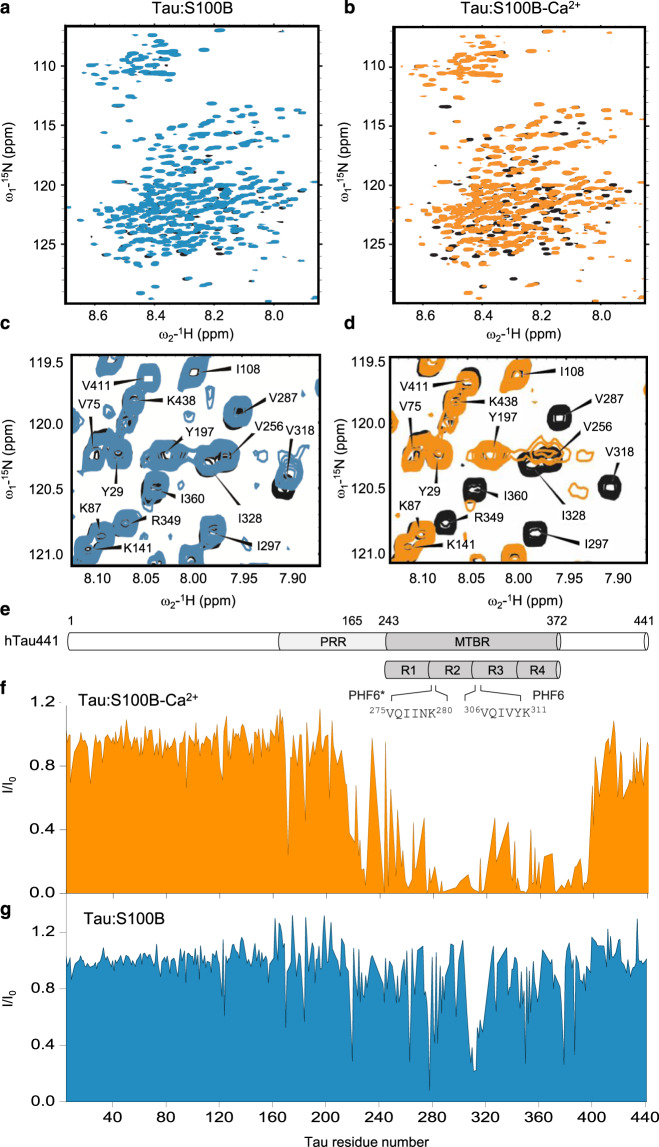
Fig. 2. Mapping S100B interactions to tau.
a, b 2D 1H,15N HSQC spectra of 100 µM 15N-tau alone (black), in the presence of 120 µM S100B and 1.25 mM EDTA (a, blue), or in the presence of 120 µM S100B and 250 µM CaCl2 (b, orange). c, d Detail of HSQC-NMR spectra evidencing tau-resonance perturbations corresponding to residues affected by S100B binding. Parts per million (ppm). e Schematic representation of full-length tau highlighting the PRR and MTBR as well as the repeat regions R1–R4 and the aggregation-prone segments PHF6* and PHF6, aligned with the x axis of plots f and g. f, g Intensity variation of each tau resonance in the presence of S100B and in the presence (f, orange) or the absence (g, blue) of calcium. Ratio of peak intensity over initial peak intensity (I/I0).

