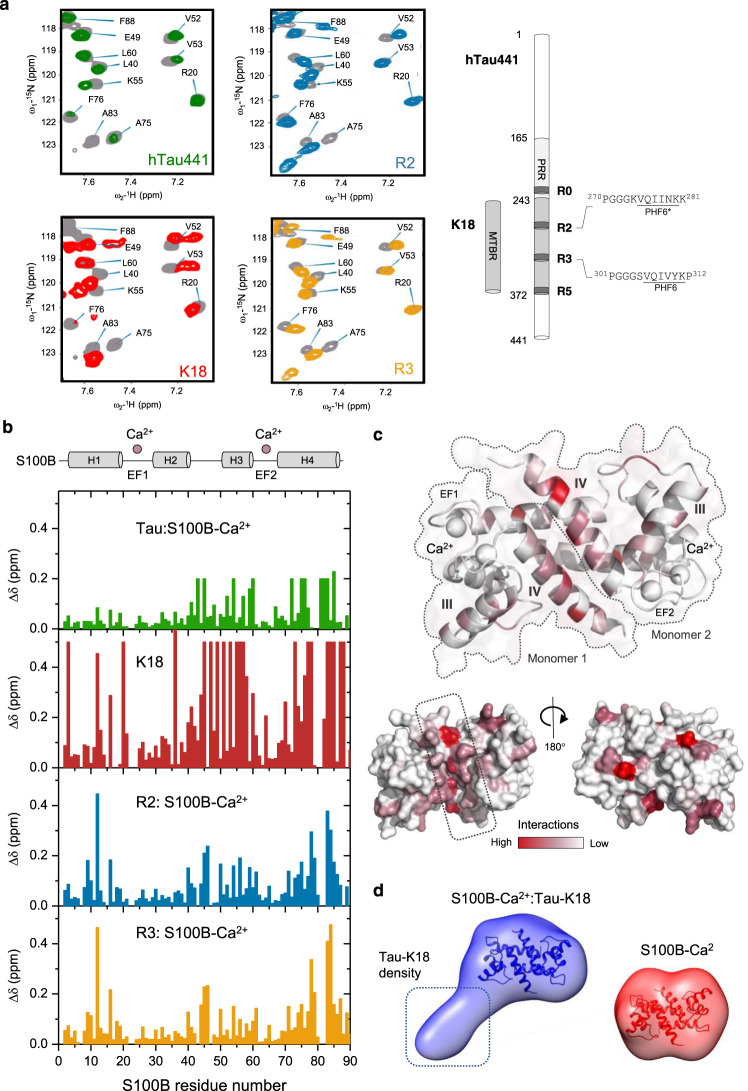
Fig. 3. Mapping tau interactions to S100B.
a Zoom of HSQC spectra evidencing chemical shift perturbation of 100 µM 15N-S100B residues in the presence of 1.25 mM CaCl2 and 160 µM full-length tau (green), 100 µM K18 (or MTBR, red), 250 µM of R2 (blue) and R3 peptide (yellow). Spectra changes upon binding of tau (green), K18 (red), and R2 (blue) and R3 (yellow) peptides to S100B-Ca2+ (alone in gray). b Plots of the chemical shift perturbation along S100B sequence following addition (from top to bottom) of full-length tau (molar ratio 1:1.6), tau K18 fragment (molar ratio 1:1), and tau peptides (molar ratio 1:2.5). Peaks broadened beyond detection are represented with a fixed arbitrary value of 0.2 (with tau) and 0.5 (with K18). Parts per million (ppm). A scheme of the secondary structures of S100B is presented above the plots, scaled according to the sequence of the x axis. c 3D mapping of the R2:S100B-Ca2+ spectral perturbations identified the S100B dimer interfacial clef (dotted box) involving helix IV as the major attachment point, chemical shift perturbations (as in a) are color-coded on the protein surface [Protein Data Bank (PDB) code: 2H61]. See Methods for details, Supplementary Figs 7 and 9 and Supplementary Movie 1. d Ab initio SAXS-derived envelopes of S100B-Ca2+:K18 complex (blue) and S100B-Ca2+ (red), see Supplementary Table 1 for data-collection and scattering-derived parameters. The crystal structure of S100B-Ca2+ fitted to both molecular envelopes is shown in cartoon representation.

