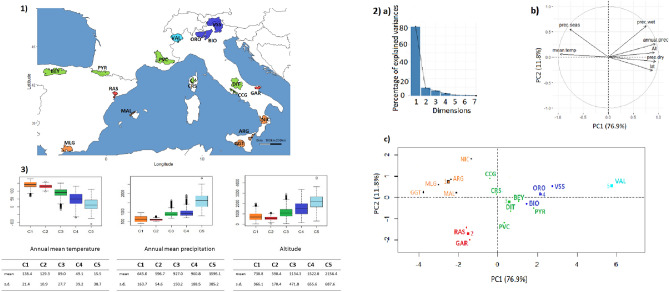
Figure 4.
Goat cradles analyses as a function of environmental variables. (1) Mapping display of the cradles coloured according to the result of the clustering. (2) HCPC analysis. (a) Scree plot. (b) PCA correlation circle. (c) PCA score plot of goat cradles. Colours represent the main clusters obtained by HCPC (K = 5). PC 1 and PC 2 represent respectively principal components 1 and 2; numbers in brackets show the variance explained by each PC. (3) Boxplot representation for the variables Mean Annual Temperature, Mean Annual Precipitation and Altitude for the different HCPC groups and associated numerical values. Alt.: Altitude in meters, T°: Temperature in °C × 10, prec.: precipitation in millimeters, min.: minimal, max.: maximal, s.d.: standard deviation.

