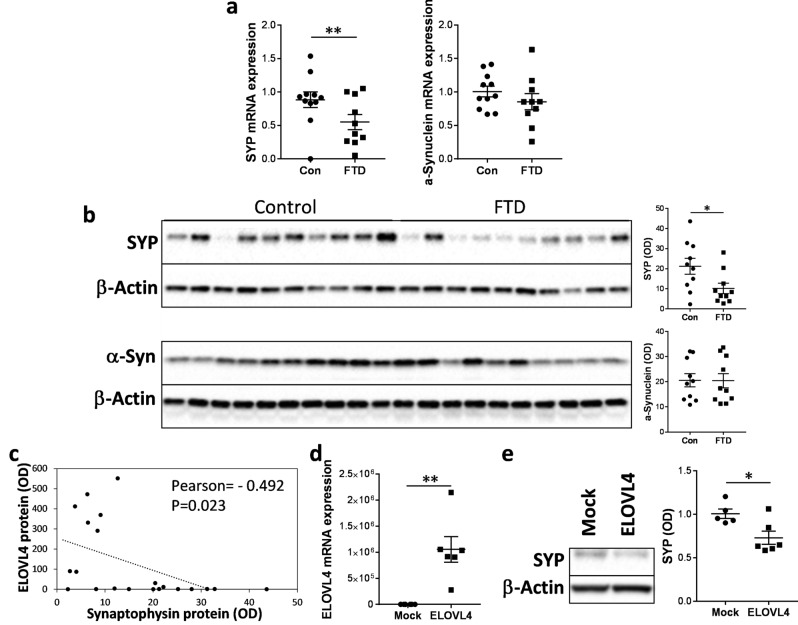
Figure 3.
Dysregulation of synaptophysin in FTD brain. (a) mRNA expression of synaptophysin (SYP) and α-synuclein, normalized to the geometric mean of β-actin, GAPDH and PPIA, in superior frontal cortex of FTD brain (n = 10) and controls (n = 11) as measured by qPCR. Multivariate analysis (general liner model), co-varying for age and sex, was used to determine significance between the two groups. (b) Protein expression of SYP and α-synuclein, normalized to β-actin, in superior frontal cortex of FTD brain (n = 10) and controls (n = 10) as measured by western blotting and optical density (OD) measurements of the protein bands. Multivariate analysis (general liner model), co-varying for age and sex, was used to determine significance between the two groups. (c) SYP protein (OD) was inversely correlated with the 37-kDa ELOVL4 protein (OD). (d) SH-SY5Y neuronal cells were transfected with ELOVL4 cDNA plasmid or empty vector (mock control) (n = 6 each; 2 experimental repeats), and ELOVL4 mRNA expression, normalized to the geometric mean of β-actin, GAPDH and PPIA, measured by qPCR. Student’s t-test was used to determine significance between the two groups. (e) SYP protein expression in the transfected SH-SY5Y neuronal cells as assessed by western blotting and OD measurements of the protein bands normalized to β-actin. Student’s t-test was used to determine significance between the two groups. Data represent mean and SE as error bars, *P < 0.05, **P < 0.005.

