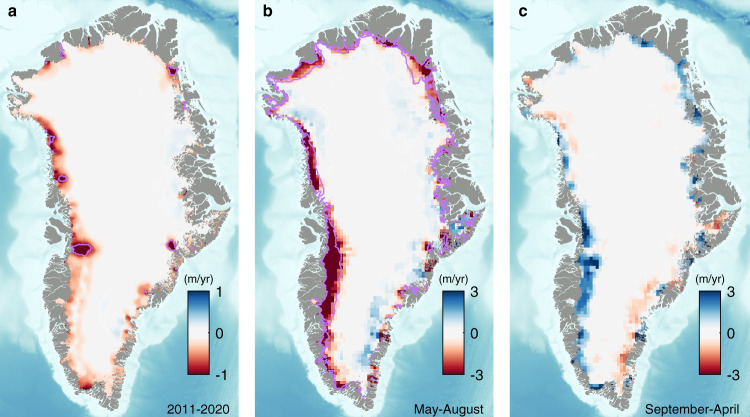
Fig. 1. Greenland Ice Sheet interannual and seasonal elevation change from CryoSat-2 radar altimetry, 2011–2020.
a Rate of surface elevation change between 2011 and 2020. Purple contours depict areas of long-term dynamical imbalance, from repeat optical imagery48,49 (1985–2018) and dynamic elevation trends determined from satellite altimetry and the Institute for Marine and Atmospheric Research Utrecht Firn Densification Model (2011–2017). b Average rates of elevation change during May–August and between 2011 and 2020. Purple contours depict the extent of the ice sheet ablation zone used in this study. c Average rates of elevation change during September–April between 2011 and 2020.

