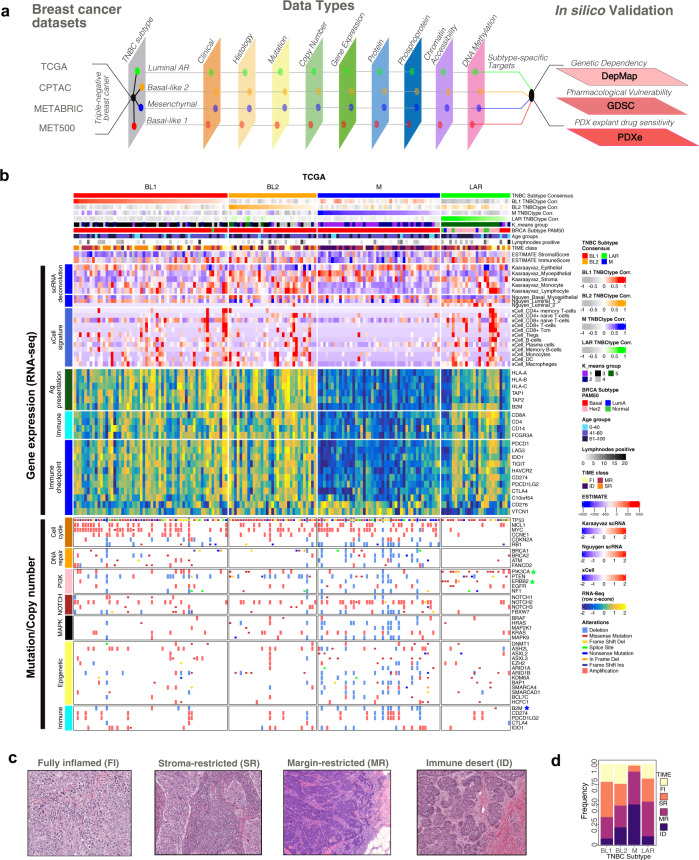
Fig. 1. Identification of TNBC subtype features through integrative genomic analyses.
a Summary of datasets and workflow used in this study. b Heatmap shows TNBC samples from TGCA stratified by subtype correlation strength and annotated for k-means group, PAM50 subtype, age, positive lymph nodes, and tumor microenvironment (TIME) classification. Gene expression heatmaps show immune cell abundance (ESTIMATE), scRNA deconvolution of normal mammary cells and immune cell lineages, relative RNA expression for immune markers, and antigen presentation and immune checkpoint genes. Mutation and copy number alterations are displayed for individual tumors and stratified by pathway. * indicates significant (p < 0.05 two-sided Fisher’s exact test, raw p-values in source file) differences in mutation/CNA in one subtype (colored) compared to all others. c Representative H&E images showing TIME classification of TCGA into fully inflamed (FI), stromal-restricted (SR), margin-restricted (MR), or immune desert (ID). These images have no scale bar because they were obtained from the TCGA Digital Slide Archive. d Barplot shows TIME quantification of images by TNBC subtype. See also Supplementary Fig. 1, and Supplementary Data 1, 2, and 3.

