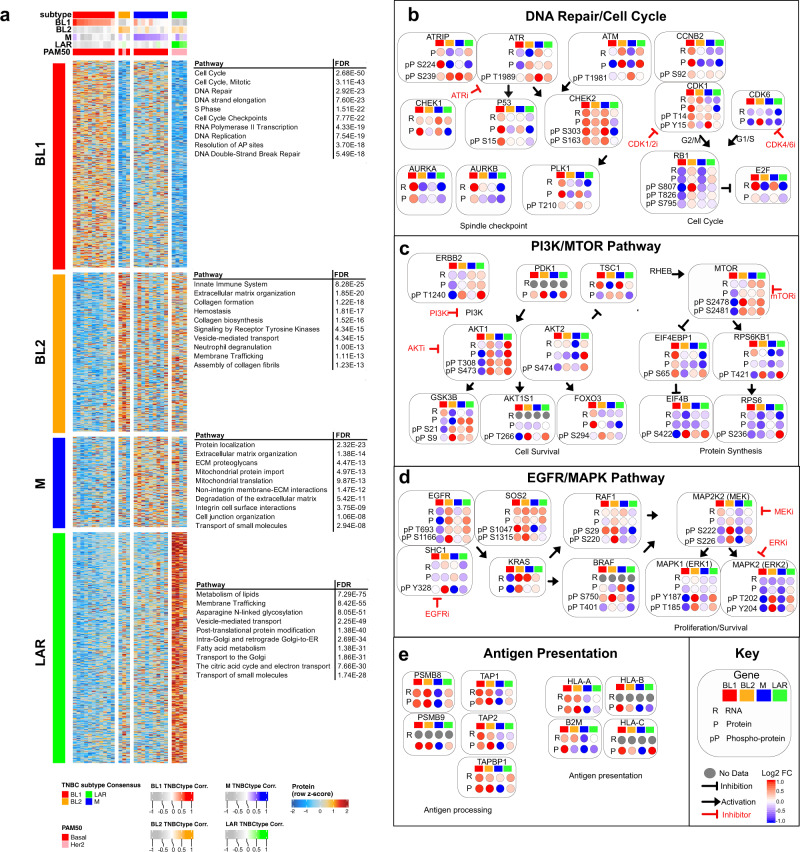
Fig. 2. Gene expression and phosphoproteomic analyses identify unique subtype-specific targetable pathways.
a Heatmap shows differentially expressed proteins (p < 0.05 and Log2 FC >1) and significantly enriched pathways (Reactome) by subtype for TNBC tumors in CPTAC. Balloon plots show integrated pathway analysis of RNA, protein, and phosphoprotein log fold change values for genes/proteins from CPTAC TNBC tumors demonstrating subtype-specific differences in b DNA repair/cell cycle, c PI3K/mTOR, d EGFR/MAPK, and e antigen presentation pathways. FDR represents the false discovery rate that the normalized enrichment score represents a false-positive finding.

