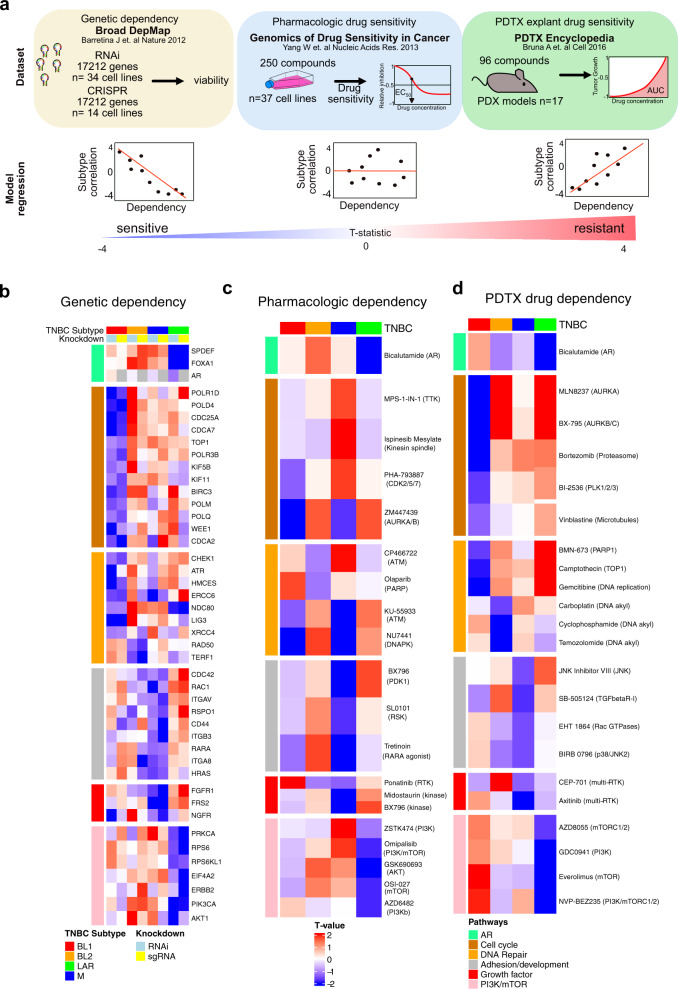
Fig. 3. In silico analyses of datasets from genetic and pharmacologic screens identifies subtype-specific vulnerabilities in TNBC.
a Datasets and workflow for identifying subtype-specific genetic dependencies and pharmacologic sensitivities. TNBC cell lines identified from datasets and subtype correlation of all cell line models with values to yield a single subtype T-value for each drug sensitivity/genetic dependency. b Subtype-specific genetic dependencies from Broad DepMap whole-genome RNAi and CRISPR screen. Overlapping genetic dependencies and drug sensitivities from both screens are highlighted in the heatmap by pathway. Heatmaps show significant subtype-specific pharmacological dependencies determined with a modified T-test corrected for multiple hypothesis testing (T-value, FDR <0.1) in c TNBC cell lines screened in the Genomics of Drug Sensitivity in Cancer or d PDX explant drug sensitivity colored by similar pathway and subtype. See also Supplementary Data 6.

