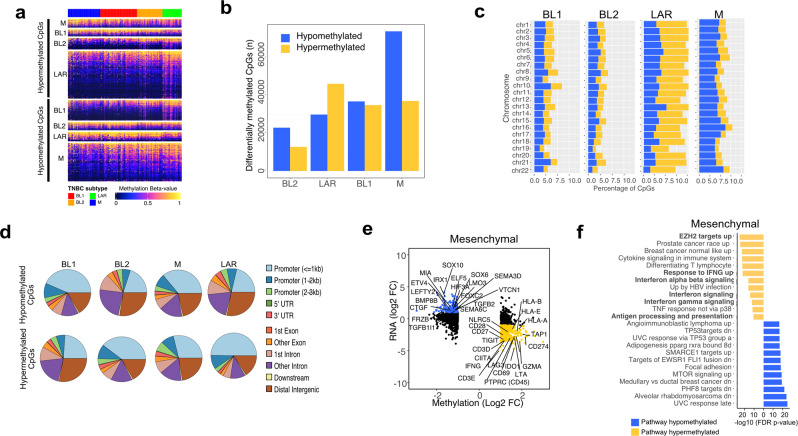
Fig. 4. TNBC subtypes differ in global methylation patterns and mesenchymal TNBCs show specific methylation for EZH2 targets and antigen presentation genes.
a Heatmap shows all differentially (FDR <0.05 and β-value>0.1) methylated CpGs by subtype. b Graph shows the number of differentially) hypomethylated and hypermethylated CpGs by TNBC subtype. c Barplots show the percentage of hypomethylated (blue) and hypermethylated (yellow) CpGs within each chromosome by TNBC subtype. d Pie charts show the distribution of differentially methylated CpG sites in each subtype by genomic location. e Starburst plots show gene expression and DNA methylation <3kb from promoter regions of corresponding genes. Significantly (FDR <0.05) hypo- and hyper-methylated promoter regions are colored in blue and yellow respectively, with genes of interest labeled in the plot. f Gene set enrichment analysis of genes negatively correlated with hypomethylated (blue) or hypermethylated (yellow) promoter methylation probes.

