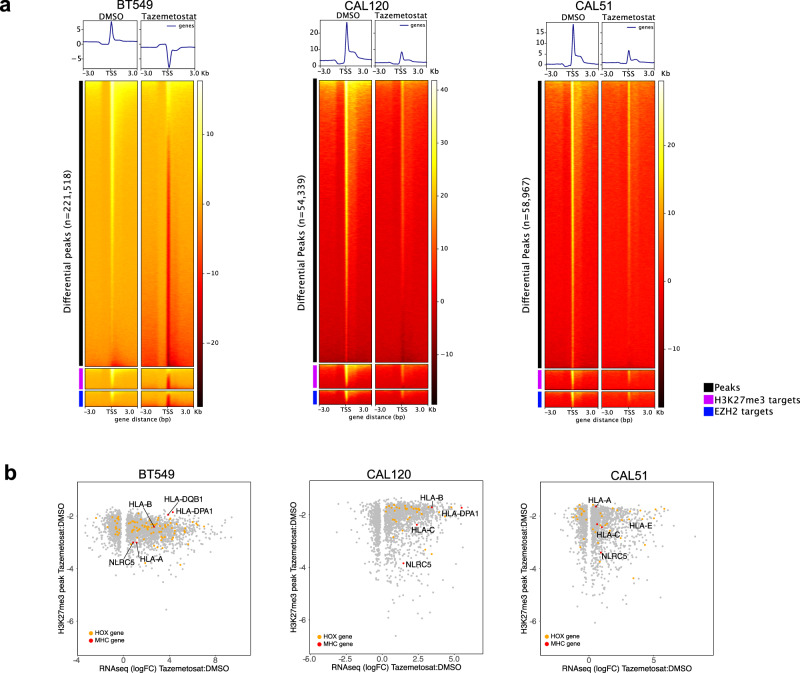
Fig. 6. EZH2 inhibition decreases global H3K27me3 and repressive marks at MHC-I locus.
a Profile plot and heatmap for H3K27me3 ChIP-seq signal for differential peak, H3K27me3 targets (BENPORATH_ES_WITH_H3K27ME3), or EZH2 targets (NUYTTEN_EZH2_TARGETS_UP) centered on transcriptional-start sites (TSS) for BT549, CAL-120, and CAL-51 cells treated for 4 days with either DMSO or 1 μM tazemetostat. Sequencing reads were normalized to reads per genomic content. b Scatterplots show differential RNA expression (Log2 FC, FDR <0.05) and differential H3K27me3 promoter occupancy (FDR <0.0.5) in tazemetostat treated cells relative to DMSO treatment.

