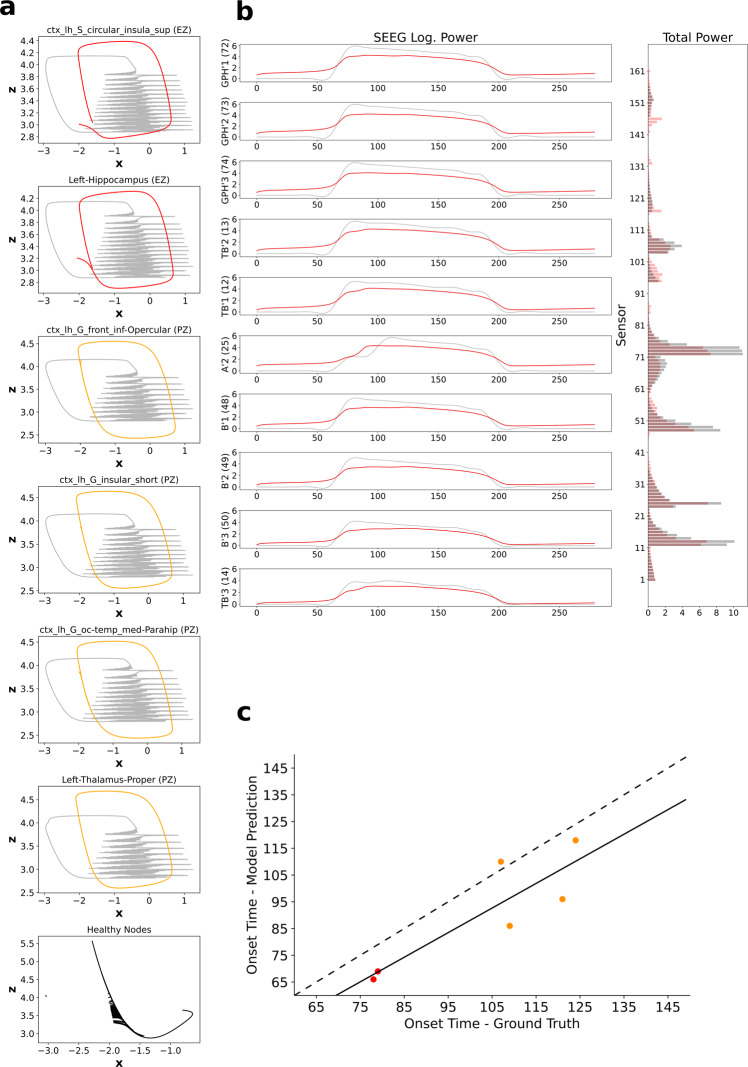
Fig. 2. Inferred seizure propagation pattern in synthetic data.
a Phase plane plots of inferred 2D Epileptor source dynamics. For comparison with the ground truth, generated using 5D Epileptor, time series of local field potential (x1(t) + x2(t)) and the corresponding permittivity variable z is shown in gray (see “Synthetic data” in “Methods”). Inferred source dynamics of regions in EZ is shown in red, regions in PZ is shown in orange, and the remaining regions are shown in black. b Comparison of model-predicted SEEG log. Power (left) of ten sensors with highest power and the augmented data feature: total sensor power (right). Observations are shown in gray and model predictions are shown in red. c Seizure-onset times in ground truth vs. model predictions. Red dots represent the seizure-onset times of regions in EZ and orange dots represent the seizure-onset times of regions in PZ. Solid line represents the linear regression fit and dashed line represents a perfect fit. EZ, epileptogenic zone; PZ, propagation zone.

