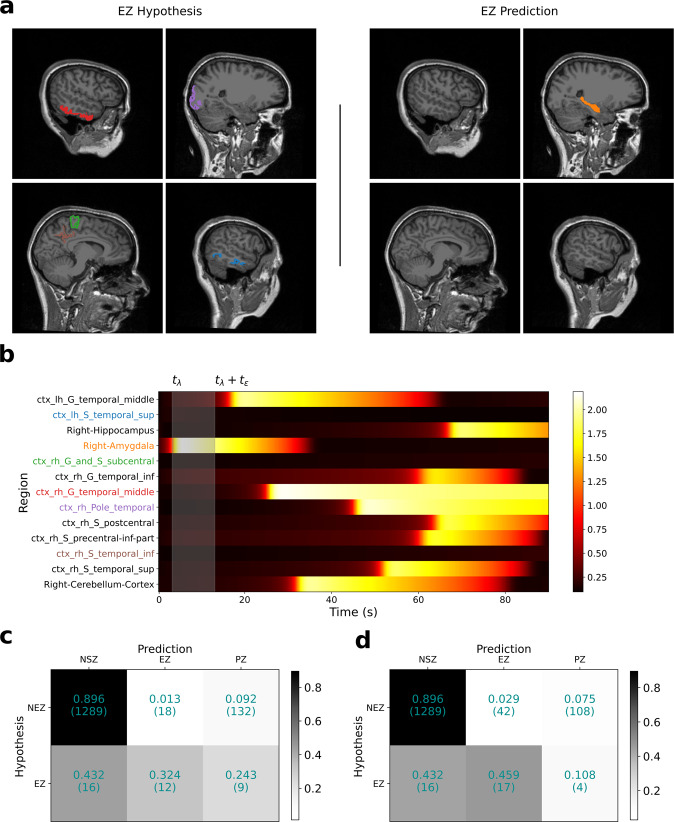
Fig. 6. Inferred seizure propagation pattern in patient FC with Engel score IV.
a Comparison of clinical EZ hypothesis (left) with model-predicted EZ (right). b Model-predicted seizure propagation pattern as observed in the predicted source power. c Confusion matrix comparing clinical classification of brain regions and model prediction-based classification across all patients in the Engel score III/IV group at onset tolerance (tϵ) of 10 s. d Same as in (c), except tϵ = 30 s. Fitting between model predictions and observed data features is shown in Supplementary Fig. 4. Ez, epileptogenic zone.

