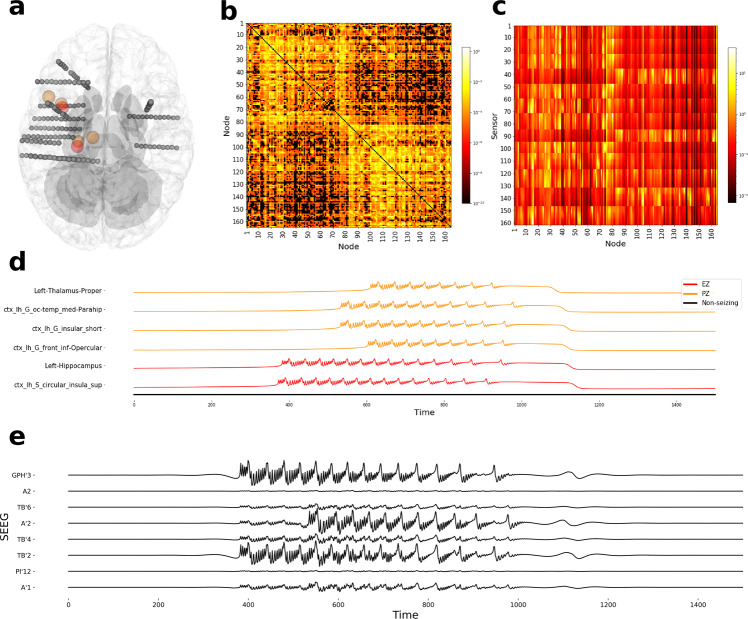
Fig. 9. Simulated seizure data generated using structural connectivity and electrode implantation of patient BT from the retrospective cohort.
a Top view of electrode implantation. Spheres colored in red and orange represent the centers of regions in the EZ and PZ, respectively. b Structural connectivity in log scale. c Gain matrix, transformation matrix from source-to-sensor space, in log scale. d Simulated local field potential (x1(t) + x2(t)) depicting the seizure propagation pattern. e Simulated SEEG activity from eight channels. EZ, epileptogenic zone; PZ, propagation zone; SEEG, stereotactic electroencephalography.

