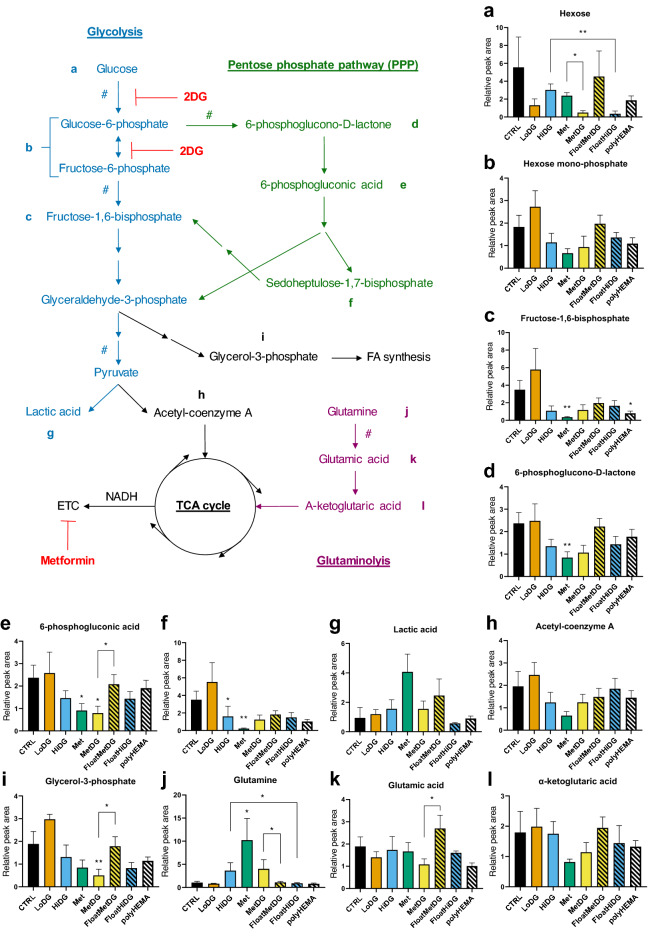
Figure 5.
Glycolysis and PPP metabolite levels per treatment groups and their floating populations. Metabolite levels were QC-normalized and mapped to glycolysis and pentose phosphate pathway to show the metabolic reactions in the cell. A single arrow denotes direct conversion in a single reaction and a segmented arrow denotes conversion with multiple step reactions. Rate limiting reactions are marked with #. Samples are color-coded and samples with floating cells are hatched. All graphs show mean relative normalized metabolite peak areas ± standard error (SEM). Please note y-axis scales are different between the plots. *p < 0.05, **p < 0.01 versus CTRL unless otherwise indicated.

